Assessment of Sustainability of Smallholder Beef Cattle Farms in the North of Tunisia
Naceur M’hamdi, Cyrine Darej, Hajer M’hamdi, Khaoula Attia, Latifa Lanouar, Rana Chouchen1, Ghazi Sadkaoui, Adel Abbes
DOI10.21767/2572-5459.100023
Naceur M’hamdi1*, Cyrine Darej1, Hajer M’hamdi2, Khaoula Attia1, Latifa Lanouar3, Rana Chouchen1, Ghazi Sadkaoui4 and Adel Abbes1
1Laboratory of Animal Genetic Resources and Agri-Food, National Agronomic Institute of Tunisia, 3 Rue Charles Nicole 1082, C. Mahrajène Tunis, Tunisia
2Ministry of Agriculture, CRDA Ben Arous. Tunis, Tunisia
3Institut Supérieur Agronomique of Chott-Meriem, University of Sousse, Tunisia
4El Badr Animal Food Route of Utique Athar Utique, Bizerte, Tunisia
- *Corresponding Author:
- Naceur M’hamdi
Laboratory of Animal Genetic Resources and Agri-Food
National Agronomic Institute of Tunisia, 3 Rue Charles Nicole 1082
C. Mahrajène Tunis, Tunisia
Tel: 216 96 849 975
Fax: 216 96 849 975
E-mail: naceur_mhamdi@yahoo.fr
Received date: January 16, 2017; Accepted date: March 15, 2017; Published date: March 22, 2017
Citation: M’hamdi N, Darej C, M’hamdi H, et al. Assessment of Sustainability of Smallholder Beef Cattle Farms in the North of Tunisia. J Anim Res Nutr 2017, 2:3. doi: 10.21767/2572-5459.100023
Copyright: © 2017 Hamdi NM. This is an open-access article distributed under the terms of the Creative Commons Attribution License, which permits unrestricted use, distribution, and reproduction in any medium, provided the original author and source are credited.
Abstract
Sustainable livestock systems should indeed be environmentally friendly, economically viable for farmers, and socially acceptable, notably for animal welfare. For that goal, many sustainability indicators and methods have been developed at the farm level. This paper aims to assess the sustainability of smallholder beef cattle farms in the north of Tunisia, where there is a national goal to improve the country’s beef self-sufficiency, and to explore and discuss potential improvement limitations and solutions. Using IDEA diagnostic method, the sustainability of 20 beef cattle farms from three regions (El-Alia, Ras Djebal and Utique) in the district of Bizerte was evaluated. The socio-territorial scale gives the limiting sustainability value (30.15) in which, the main way of progress relies on quality of product (7.85), ethics and human development (9.65). However, economic sustainability is determined by low level of efficiency (8.55) which depends on financial independence (3.6) and a high level in economic viability (18.5). Socio-territorial scale is the only one which is not linked to production system and is based on farmer’s way of life. On the other hand, global sustainability evaluation of farm as well as creating collective references means to be able to analyze links between the three sustainability scales.
Keywords
Assessment; Beef farms; IDEA method; Sustainability; Tunisia
Introduction
Most of the beef cattle farming in Tunisia are based on smallholder farming systems [1]. The continuity of small family farms is a key point when discussing the sustainability of livestock farming systems [2], including the capacity of a smallholder farming system to contribute to the local economic systems through their contribution to foster employment and increase family income [3]. Sustainability and proof of sustainability is rapidly becoming an expectation of modern production systems. Consumers demand that the food they buy is produced in the most sustainable way possible. Throughout human societal evolution, the term sustainability has had myriad definitions. Although defined by Wiersum [4] and Wilderer [5] it hasnt become an important policy concept unti l the 1980s, when concerns about excessive resource use drove publication of a report by the United Nations World Commission on Environment and Development [6]. The Brundtland Report, as it is more commonly known, indicates that sustainable development must integrate social, economic, and environmental concerns, and that on a global scale, an absolute plan to improve sustainability is difficult to develop because of the complexity of the systems involved [6]. Although the exact definition of sustainability has been debated extensively since the Brundtland Report [7,8] most scholars agree that the three sustainability pillars presented in the report (environmental impact, economic viability, and social acceptability) are qualities of sustainable systems. The beef industry has defined sustainability as meeting the growing demand for beef by balancing environmental responsibility, economic opportunity, and social diligence. However, the sustainability of production systems depends on many, often interrelated, factors which themselves vary from system to system and evolve over time [9]. Measuring sustainability is challenging and difficult, as it is site-specific and a dynamic concept [10]. An understanding of sustainability in animal production is becoming increasingly necessary since the global demand for food is expected to dramatically increase in the coming decades.
The main aim of this study is to assess the sustainability of smallholder beef cattle farms in the district of Bizerte at the north of Tunisia.
Material and Methods
Study area and selected farms
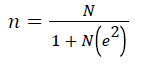
The study was conducted in three zones (El-alia, Ras Djebel and Utique) in the district of Bizerte which is located in the north of Tunisia, characterized by a mild and humid climate and an average temperature of 22.8°C with an average rainfall of 600-800 mm/year. These areas are characterized by smallholder fattening farms that serve nearby urban areas of Bizerte and Tunis. Beef cattle farming is the main agricultural activity in Bizerte, over 90% are small farms with herds between 10 and 30 beefs. The study involved 20 intensive beef cattle farms selected based on their responsiveness and cooperative spirit in order to recover the maximum amount of information. Animal were fed with concentrate (3.5 kg per head), hay (2.5 kg), and/or straw (2.5 kg). The duration of fattening is 245 days, it varies from one breeder to another and it is function of the age and the weights of the bulls at slaughter. Farms were visited once during 2015. The sample size from each selected district was chosen according to the equation:
 [11]
[11]
Where: n= Sample size N= Population e= Precision level (error term).
Data collection
Field work was carried out in three stages. The first exploratory study identified the production system. The aim of it was to contact and to give an overview of the study to the stakeholders in the study area. It was also meant to collect basic data needed to plan the final sample size. It was started by pretesting the questionnaire to test the relevance of the contents and the way it was presented in the specific conditions of districts. The second stage consist of a comprehensive data collection, covering the topics of cattle distribution and performance, forage availability and quality, farm characteristics, production pattern, household socio-economic condition and indicators used for sustainability analysis. The third stage was used to finalize the selection of sustainability indicators defined in the previous stage and to collect additional data needed for estimating the sustainability from at least 85% of the respondents who participated in the second field work stage. Methods used in this stage were focus group discussion and pretesting of indicators by farmers.
Sustainability assessment
The evaluation of the sustainability of beef cattle farms was carried out in accordance with an adaptation of the IDEA method (Indicateurs de Durabilité des Exploitations Agricoles), which was developed in France and validated in many countries [12-15]. It assigns scores to the farmer's practices and behaviour and measures the sustainability of different types of farms by using three scales: the agroecological, socioterritorial and economic scales. These three scales of sustainability contain three or four components (making a total of 10 components), which in turn contain indicators (41 indicators). These indicators represent the variables to be assessed.
The adaptation of the IDEA method was made for the present study allowed the characteristics of visited farms, the production system, the current challenges facing the livestock sector (increasing input prices and competitiveness) and the trends of the future (quality products, and environmental and social services) to be integrated into the evaluation of the systems’ sustainability. The questionnaire includes 83 questions and allows to describe the farms on the basis of various aspects of their production system, and to calculate sustainability indicators according to the IDEA method. It includes various components affecting the human, livestock, food, agricultural land and irrigation systems, the environment and product quality and economy. The calculation of the indicators is performed automatically for each of the three scales on different sheets and paper summarizes the results and graphs obtained by indicator, component and scale. The selected set of indicators mainly includes (1) environmental indicators focusing on farmer practices; (2) quantitative economic indicators; and (3) quantitative social indicators with a low degree of aggregation. The selection of indicators should consider (1) contextualization to determine purpose, scales, and stakeholders involved in the assessment; (2) the comparison of indicators based on various criteria, mainly data availability; and (3) the selection of a minimal, consistent, and sufficient set of indicators. The survey was conducted by visiting the farms and interviewing the farmers.
Statistical analyses
Scores of each scale for each farm (n = 20) were analyzed with SAS [16]. The following analytical techniques were used to achieve the objectives of the study: Descriptive statistics such as measures of central tendency like mean, percentages and frequency.
Results and Discussion
Global sustainability scores
Figure 1 illustrates the results of the sustainability assessment for visited farms. Global sustainability score is the lowest mean value among the three scales values as it will be on this scale that the breeder should focus its efforts. According to Valentin and Spangenberg, [17], sustainable agriculture combines, social, economic and environmental dimensions. And a focus on only one dimension at the expense of others may be risky [18]. Indeed, in this study, sustainability is limited by socio-territorial scale with a sustainability average score of 30.15 ± 2.46. The most serious handicap is the unsustainably low level of social scale. This results in agreement with those of M'hamdi et al. [13] and Bekhouche-Guendouz et al. [19], in dairy farms in Tunisia and Algeria, respectively. They showed that the socio-territorial level is the determinant of sustainability although the sustainability score in this study is lower than those found by the two authors with respectively average score of 37.23 and 52.5.

Figure 1: Global sustainability score of studied farms.
The low score of social sustainability can be explained by the low coherence between the farmers and the preference of the majority of them to live in cities away from farms. In addition, the farmer has a low intellectual and technical level. We reported that almost 5% of farmers have a university diploma against 30% with a secondary education level and 60% having a primary level and 5% are illiterate.
Components scores
Figure 2 shows the scores of components of sustainability for all farms. We note that the components; quality of products and territories, ethics and human development and efficiency values have the lowest values, respectively 7.85; 9.65 and 8.55. Figure 2 is a visual aid to assess sustainability as the surface area covered by the line joining component scores in relation to surface area defined by the outside perimeter and to identify easily strengths and weaknesses. Hence, Figure 2 shows that the farms studied ranked high for diversity, and farming practices and viability, but low for efficiency and product quality.

Figure 2 Radar representations of farm sustainability components.
Analysis of sustainability’s indicators
Indicators of environmental scale: The analysis of the environmental sustainability of fattening farms showed very different levels of sustainability depending on the production system. Table 1 shows the overall result as the sum of agroenvironmental sustainability indicators. The results for agroecological scale are the highest; this is confirmed by the higher scores of indicators related to animal diversity (14 points), due to the presence of more species (cattle, sheep, and other livestock).
| Agro ecological scale | |||
|---|---|---|---|
| Component | Indicators | Score | Norms |
| Local diversity | Diversity of annual crops | 7.7 | 0 - 14 |
| Diversity of perennial crops | 2.85 | 0 - 14 | |
| Animal diversity | 14 | 0 - 14 | |
| Conservation of local genetic resources | 0 | 0 - 6 | |
| Organization of space | Crop rotation | 4.4 | 0 - 8 |
| Plot size | 6 | 0 - 6 | |
| Organic matter mangement | 0.95 | 0 - 5 | |
| Ecologic zone regulation | 2.85 | 0 - 12 | |
| Contribution to environmental issues of territory | 0 | 0 - 4 | |
| Space management | 1.35 | 0 - 5 | |
| Fodder surfacfe management | 0.5 | 0 - 3 | |
| Farming practices | Fertilization | 0 | 0 - 8 |
| Liquid effluents management | 0 | 0 - 3 | |
| Pesticides | 12.05 | 0 - 13 | |
| Veterinary treatment | 1.7 | 0 - 3 | |
| Soils protection | 1.3 | 0 - 5 | |
| Water resources management | 3.05 | 0 - 4 | |
| Energy dependence | 6.7 | 0 - 10 | |
| Total | 65.4 | 0 -100 | |
Table 1 Sum of agro-environmental sustainability indicators.
For domestic diversity component, the conservation of local genetic resources and perennial crops indicators has the lowest values 0 and 2.85. Although, the two values can be achieved, respectively, 6 and 14 if breeders practice perennial crops and preserves the local genetic resources.
These results are consistent with those of Van Bol [20] who evaluated the pilot farms comparing ranked in group indices. The indicator size of fodder surface has a score of 6 points; farmers with less agricultural land are forced to diversify crops which led to small-land size used for fodder production. Hence, for the organization of space, the lowest scores (0; 0.5 and 0.95 points) are recorded for the contribution to environmental issues of territory, management of fodder areas and organic matter management, respectively. The energy dependence indicator has a score of 6.7 points, because of the rational use of electricity and fuel. For management of water resources we recorded a score equal to 3.05 points, while the maximum of the scale is 4 points, this is explained by the fact that fodder crops are irrigated for a little time.
These results are confirmed by Damjan and Glavic [21] who reported that it is essential to integrate the water availability factor in the assessment of environmental sustainability.
The weakness of environmental scale is explained mostly by the mismanagement of annual and temporary cultures (7.7 points) and the absence of legumes culture because of the ignorance of farmers to their interests (improving soil fertility, livestock feed), the high cost of the seed, and their high water demand.
The indicator organics matter management has a score equal to 0.95 points due to the use of manure on less than 20% of the agricultural surface and the indicator ecological areas has a score equal to 2.85 points because of the scarcity of water point and reduced areas reserved for the natural environment (less than 5% of the agricultural surface).
For the space valorization, we reported a score of 1.35 points, due, in part, to insufficient surface reserved to fodder production which cannot meet livestock needs in the majority of farms. However, for farming practices, the lowest scores were recorded in fertilization and liquid effluents management (0 points) and the highest value for use of pesticides (12.05 points).
Indicators of social scale: Social background of farmers includes family origin, education, professional carrier and other various components of social inequality, lifestyle and norms. The analysis of the socio-territorial scale (Table 2) shows that, for quality of products and territories component, quality approach indicator has the lowest score (0) compared to availability of space which has the highest score (2.7). The score (0) recorded for quality approach is explained by the fact that farmers give little importance to the quality of life. Farmers neglect maintenance of animal houses and landscapes, which explains the low score of this indicator (1.7 points). Indeed, the evolution of agricultural systems towards sustainability is also facilitated through the collective work and the sharing of equipment and services, which is not the case for farmers in the study area. The reception, health and safety indicator has the lowest score (0.3) compared to other indicators of the same scale. Indeed, 65% of farmers contributing to the employment which allows a high score of the inductor contribution to employment, but does not show a sufficient safety and quality of life to stay in some farms. Management of non-organic waste, heritage and landscape enhancement and social involvement are noted respectively, 1.65; 1.7 and 1.8. Concerning the ethical and human development component, due to low ratings of indicators: contribution to the global food balance, learning and work intensity and with respective scores of 0.9; 0.7 and 0.35. Also, the 20 farms rely on family labor, which explain the lower score of employment and service (12.65 points) but represents several advantages in these systems since, besides providing occupation in the rural areas, makes them more efficient, competitive, and indeed sustainable [22,23]. The result of the socio-territorial level is acceptable compared to Gamborg and Sandøe [24] that reported weak results due to lack of training and low scores of "employment services" component. They explained the variability of score of the contribution to employment indicator by the lack or insufficiency of technical knowledge. However, farmers have adapted new techniques to their socio-economic conditions by selecting items that suit their changing conditions. However, in this scale, the highest score is given to animal welfare indicator due to the acceptable condition of animal housing, the absence of any stressor, good aeration and the lack of animal diseases and good body condition of the animals in most farms visited. Overall, the quality of a territory depends on the quality of human relations, and the associative structure. This component can be improved through the involvement in associative structures, but in the study area’s involvement in these structures remains low, which explains the low score of the indicator social involvement (1.8). Our study indicates that 40% of farmers intend to operate in this sector in the next ten years and 35% are still hesitant. For indicator training, the score was 0.7 and it is considered low compared to the standard (6) due to lack of training. For indicator quality of life, studied farmers had the same perception of their quality of life, likely due to similar working time. However, Laurent et al. [25] and Caramelle-Holtz et al. [26] showed that the work fees were higher in lactating dairy farms.
| Social Scale | |||
|---|---|---|---|
| Components | Indicators | Score | Norms |
| Quality of products and territories | Quality approach | 0 | 0 -10 |
| Enhancement of built heritage and landscape | 1.7 | 0 - 8 | |
| Management of non-organic waste | 1.65 | 0 - 5 | |
| Availability of space | 2.7 | 0 - 5 | |
| Social implication | 1.8 | 0 - 6 | |
| Employment and services | Valorization of short courses | 1.1 | 0 - 7 |
| Development of local resources | 6.2 | 0 - 10 | |
| Services | 0 | 0 - 5 | |
| Contribution to employment | 3 | 0 - 6 | |
| Collective work | 0 | 0 - 5 | |
| likely sustainability | 2.35 | 0 - 3 | |
| Hum development and ethics | Contribution to the global food balance | 0.9 | 0 - 10 |
| Animal welfare | 3 | 0 - 3 | |
| Learning | 0.7 | 0 - 6 | |
| Work intensity | 0.35 | 0 - 7 | |
| Life quality | 3.3 | 0 - 6 | |
| segregation | 1.1 | 0 - 3 | |
| Reception, health and safety | 0.3 | 0 - 4 | |
| Total | 30.15 | 0 - 100 | |
Table 2 Sum of social sustainability indicators.
Indicators of economic scale: Economic sustainability was apprehended through six criteria (Table 3). The performance of farms was different. The Table 3 shows that the sustainability index value of economic dimension is 30.15%, which is the index interval between 0- 100%, it is mean that sustainability status is quite (fairly sustainable). This score is lower than that found by Agus and Yuprin [27] who reported a score of 63.10% in a study of sustainability of beef cattle fattening in Indonesia. Moreover, in these dimension, the rate of specialization and financial autonomy indicators have the lowest average values (2.9 and 3.6 points) reflecting the non-specialization of farmers beef production and lack of technical knowledge on fattening. The score of specialization indicator is the lowest (2.9), compared to other indicators, which is confirming the non-specialization of farms in meat production or the little size of farms, and while the highest score (10 points) is awarded to aid sensitivity indicator which explains the dependence on public assistance. In addition, the economic viability indicator had a high score (15.6 points) due to acceptable profitability of farms confirming other studies [28]. In addition, the results of our study showed an average transmissibility (11). Regarding financial autonomy, the score is low (3.6) explained by the high annual fees which will affect farms efficiency. Hashem et al. [29] is corroborated by the finding of present study, they also reported that lack of credit facilities, price variation in different markets, disorganized marketing system were the problems for beef fattening.
| Economic scale | |||
|---|---|---|---|
| Components | Indicators | Score | Norms |
| Viability | Economic viability | 15.6 | 0 – 20 |
| Economic specialization rate | 2.9 | 0 – 10 | |
| Independence | Financial autonomy | 3.6 | 0 – 15 |
| Sensitivity for Governmental aid | 10 | 0 – 10 | |
| Transferability | Transferability | 10.7 | 0 – 20 |
| Efficiency | Efficiency of the production process | 8.85 | 0 – 25 |
| Total | 51.35 | 0 – 100 | |
Table 3 Sum of economic sustainability indicators.
Conclusion
Cattle fattening enterprise is a potential and effective option for poor and extreme poor and gained prominence as an important agribusiness sector in Tunisia. The study of sustainability of cattle farms in fattening farms gave an overall picture concerning their durability. Beef cattle fattening in the north of Tunisia, have less sustainable status with a score of 30.15. Environmental and Economic dimensions have quite (fairly sustainable) status with 65.4 and 51.35. The results indicate possible development pathways for sustainable farms through some social, ecological and economic indicators. Sustainable agriculture combines the social, economic and environmental dimensions and a focus on only one dimension at the expense of others may be risky. Concluding that these farms are sustainable is a starting point to give the small-scale meat the importance that they have, and sets the path to strengthen those practices that make them more sustainable.
Acknowledgment
We thank Mme Ahlem M’hamdi for English revision.
Conflict of Interest
None.
References
- Fezaï E, Oueslati I (2006) Etude des systèmes de production de viande bovine dans le gouvernorat de Jendouba. Mémoire de Fin d’Etudes du Cycle Technicien Supérieur. ESA du Kef.
- Bernués A, Ruiz R, Olaizola A, Villalba D, Casasús I (2011) Sustainability of pasture-based livestock farming systems in the European Mediterranean context: Synergies and trade-offs. Livest Sci 139: 44-57.
- FAO (2013) SAFA: Sustainability assessment of food and agriculture systems guidelines, version 3.0, Rome: Food and Agriculture Organization of the United Nations.
- Wiersum KF (1995) 200 years of sustainability in forestry: lessons from history. Environ Manage 19: 321-329.
- Wilderer PA (2007) Sustainable water resource management: the science behind the scene. Sustain Sci 2: 1-4.
- World Commission on Environment and Development (1987) Our common future. Oxford Univ. Press, New York, USA.
- Bonevac D (2010) Is sustainability sustainable? Acad Quest 23: 84-101.
- Chichilnisky G (2011) What is sustainability? Int J Sustainable Econ 3: 125-140.
- Ripoll-Bosch R, Díez-Unquera B, Ruiz R, Villalba D, Molina E, et al. (2012) An integrated sustainabilityassessment of Mediterranean sheep farms with different degrees of intensification. Agric Syst 105: 46-56.
- Ikerd J (1993) Two related but distinctly different concepts: organic farming and sustainable agriculture. Small Farm Today 10: 30-31.
- Yamane T (1967) Statistics, An introductory Analysis. (2ndedn), Harper and Row, New York pp 258.
- Fadul-Pacheco L, Wattiaux MA, Espinoza-Ortega A, Sánchez-Vera E, Arriaga-Jordán CM (2013) Evaluation of sustainability of smallholder dairy production systems in the highlands of Mexico during the rainy season. Agroecol sust food 37: 882-901.
- M’hamdi N, Aloulou R, Hedhly M, Ben Hamouda M (2009) Évaluation de la durabilité des exploitations laitières tunisiennes par la méthode IDEA. Agron Soc Environ 13: 221-228.
- Vilain L, Girardin P, Mouchet C, Viaux P, Zahm F (2008) La méthode IDEA: indicateurs de durabilité des exploitations agricoles: guide d’utilisation, Dijon. Educagri Ed 3.
- Zahm F, Viaux P, Vilain L, Girardin F, Mouchet C (2008) Assessing farm sustainability with the IDEA method—From the Concept of agriculture sustainability to case studies on farms. SUSTAIN DEV 16: 271–281.
- SAS Institute Inc. (2009) SAS/STAT User’s guide. Cary, NC: SAS Institute, Inc.
- Valentin A, Spangenberg JH (2000) A guide to community sustainability indicators. Environ Impact Assess Rev 20: 381–392.
- Yunlong C, Smit B (1994) Sustainability in agriculture: a general review. Agric Ecosyst Environ 49: 299-307.
- Bekhouche-Guendouz N, Marie M, Yakhlef H, Ghozlane F (2008) Mitidja. Colloque international. Développement durable des productions animales : enjeux, évaluation et perspectives Alger, Avril 20-21.
- Van-Bol V (2000) Azote et agriculture durable, approche systémique en fermes pilotes. Thèse de doctorat: Laboratoire d'Ecologie des Prairies, Université Catholique de Louvain-la-Neuve, Belgique.
- Damjan K, Glavic P (2005) A model for integrated assessment of sustainable development. Resour Conserv Recy 43: 189-208.
- Hemme T, Otte J (2010) Status of and prospects for smallholder milk production-A global perspective, FAO, Rome.
- McDermott JJ, Staal SJ, Freeman HA, Herrero M, Van de-Steeg JA (2010) Sustaining intensi?cation of smallholder livestock systems in the tropics. Livest Sci 130: 95–109
- Gamborg CH, Sandøe P (2003) Breeding and biotechnology in farm animals, ethical issues. In: Levinson R, Reiss M (eds) Key issues in bioethics. London: Routledge Falmer pp. 133-142.
- Laurent C, Chassaing C, Agabriel CA, Agabriel Cl (2009) Durabilité des systèmes d'élevage bovin en zone de montagne herbagère du Cantal Sustainability of the bovine breeding system in the grassland mountain area, Cantal. Renc Rech Ruminants.
- Caramelle-Holtz E, Chauvat S, Ethève F, Kentzel M, Moreau JC, et al. (2004) IE et CRA Aquitaine.
- Agus Y, Yuprin AD (2015) Sustainability analysis of beef cattle fattening in Ciamis Regency, West Java Province, Indonesia. Journal of Economics and Sustainable Development 6: 148-154.
- Castellini C, Boggia A, Cortina C, Dal Bosco A, Paolotti L, et al. (2012) A multicriteria approach for measuring sustainability of different poultry production systems. J Clean Prod 37: 192-201.
- Hashem MA, Moniruzzaman M, Akhter S, Hossain MM (1999) Cattle fattening by rural farmers in different districts of Bangladesh. Bang J Anim Sci 28: 81-88.

Open Access Journals
- Aquaculture & Veterinary Science
- Chemistry & Chemical Sciences
- Clinical Sciences
- Engineering
- General Science
- Genetics & Molecular Biology
- Health Care & Nursing
- Immunology & Microbiology
- Materials Science
- Mathematics & Physics
- Medical Sciences
- Neurology & Psychiatry
- Oncology & Cancer Science
- Pharmaceutical Sciences