The Effects of Captivity on Diet and Lifespan in White-Tailed Deer (Odocoileus virginianus)
Schipansky AK, Gumkowski E, Klemz M, Wilks S
DOI10.21767/2572-5459.100048
General Ecology-EEB 381, Biological Station, University of Michigan, United States
- *Corresponding Author:
- Schipansky AK
General Ecology-EEB 381
Biological Station
University of Michigan
United States
E-mail: aschipansky@gmail.com
Received date: August 04, 2018; Accepted date: August 29, 2018; Published date: September 07, 2018
Citation: Schipansky AK, Gumkowski E, Klemz M, Wilks S (2018) The Effects of Captivity on Diet and Lifespan in White-Tailed Deer (Odocoileus virginianus). J Anim Res Nutr 3: 2: 4.
Copyright: © 2018 Schipansky AK, et al. This is an open-access article distributed under the terms of the Creative Commons Attribution License, which permits unrestricted use, distribution and reproduction in any medium, provided the original author and source are credited.
Abstract
White-tailed deer (Odocoileus virginianus) born and raised in captivity live, on average, three times longer than wild populations. Raising white-tailed deer in captivity brings about significant changes to their diet. Nutrition has been shown to play an important role in survival and reproduction of white-tailed deer. This study seeks to determine the effects of captivity on diet and health in white-tailed deer and how this affects their lifespan. Fecal samples from captive and wild white-tailed deer populations were collected, in northern Michigan, and analyzed using gas chromatography-mass spectrometry and stable isotope analysis. The study results suggest that captive white-tailed deer consume significantly different diets and nutrients than wild populations, based on the stable isotope and principal component analysis.
Keywords
White-tailed deer; Populations; Diet; Reproduction; Nutrition
Introduction
Throughout Michigan, white-tailed deer (Odocoileus virginianus) populations occupy every county in the state [1]. White-tailed deer inhabit young forests and brush, where food is readily accessible and close to the ground [1]. The deer in the Upper Great Lakes Region are found to eat mostly woody browse, conifer needles, evergreen forbs, non-evergreen forbs, deciduous leaves, fruit, and fungi [2]. However, their diet varies seasonally, as ground cover changes throughout the year [2]. More specifically, in the spring, they browse grasses, sedges, bracken fern, and wood anemone [2]. Classically considered an “edge species”, white-tailed deer thrive in environments where cover and food are juxtaposed. The ability to survive in a variety of habitats, due to their flexible diet, allows them to migrate seasonally and stray far from their home ranges [3].
Due to the large presence of white-tailed deer throughout the state of Michigan, they are recognized as a valuable resource for hunting and tourism [3]. In the midwest, where hunter participation exceeds the national average [3], white-tailed deer have become one of the most sought-after game animals in North America [4]. Driven primarily to raise bucks for hunting purposes, the captive deer industry has grown significantly in the Midwest, over the last 25 years [3].
In this study, captivity is defined as having limited space, high population density, low vegetation, human disturbance, and supplementary feed [5]. The captive white-tailed deer industry profits most from selling breeding stock and antlers but also profits from tourism on the deer “farm” [3]. As captive and wild white-tailed deer populations continue to grow throughout Michigan, their economic contributions will, as well.
Raising white-tailed deer in captivity brings about significant changes to their diet. In captivity, supplemental feed is used because the deer feed on native plants faster than they can regrow. Additionally, captive deer are not exposed to the same variety of vegetation as the wild population. In other studies, variations in diet have shown to affect overall body mass and the size of antlers on male deer [6]. Low relative body mass can place substantial limitations on breeding success, in captivity, often leading to decreased fitness in the white-tailed deer population [6]. Depending on the soil fertility, precipitation patterns, and nutrient supplementation in captivity, phenotypic characteristics can be expressed differently than wild populations [7].
Nutrition has shown to play an important role in the survival and reproduction of wild and captive white-tailed deer populations [8]. The main constraint for wild populations is food availability, while the needs of captive deer are met daily. The captive population used in this study was fed a diet of apples, carrots, crackers, straw, supplemental feed, and mineral blocks. Evidence shows that protein constraints can be a nutritional challenge for wild populations. During periods of high body growth, such as fetal growth and lactation, protein requirements are highest, posing further challenges for wild populations [8]. During winter, wild white-tailed deer discern differences in protein content of plants, in order to increase foraging rates on plants with high protein content [9].
Body size and condition are a result of protein demands and food intake and have direct consequences on reproduction and overall fitness. Wild populations with access to higher nutritional levels at the beginning of winter are shown to survive longer, as the regain of body mass in the spring is crucial for adult survivorship [8]. Wild white-tailed deer populations, in general, live about four years; conversely, deer raised in captivity live six to fourteen years [10]. While diet is thought to influence the health of white-tailed deer, it is unclear whether the extended lifespan of captive populations is a result of differences in diet or other confounding variables.
Another factor contributing to the survivorship and health of wild white-tailed deer populations is exposure to predation. Many studies have documented that coyotes (Canis latrans) are the greatest source of natural mortality for neonate deer. Coyotes have expanded into the eastern United States over the last 100 years, but their range expansion shows little evidence of declines in deer populations [11].
Another top predator that has expanded into the Great Lakes Region is the coywolf (Canis latrans x Canis lupus), a coyote-wolf hybrid [12]. Due to wolf heritage, the coywolves are comfortable inhabiting forests, where they hunt in small packs. The size of coywolves leaves larger prey, such as white-tailed deer, more vulnerable to pursuit. Sources of predation, such as coyotes and coywolves, shorten the lifespan of wild white-tailed deer.
While white-tailed deer raised in captivity consume a different diet than wild populations, the extent of these differences and the effects they have on overall health and lifespan of the deer is unknown. This study explores how diet differs between captive and wild white-tailed deer populations, in northern Michigan. Differences in diet are used to analyze the potential effects on health and lifespan of white-tailed deer. Variation in diet is analyzed using stable carbon and nitrogen isotopes and a principal component analysis of fecal samples, from wild and captive white-tailed deer populations. Stable carbon isotopes are used to distinguish differences in consumption of C3 and C4 plants.
The principal component analysis allows us to make predictions of what the deer are eating, based on their habitat and the significant components identified. We expect to see larger values of stable carbon isotopes, indicating the consumption of more C4 plants in captive populations, such as corn. Additionally, we expect to see larger values of stable nitrogen isotopes in the captive population because they are fed a mineral block, which is a potential source of protein. Differences in overall health are determined through further analysis of the principal components. In the analysis, the principal components are identified to show differences in diet. We predict that significant components found in the samples will differ between wild and captive populations.
Methods
Study sites
Two study sites were chosen, to compare wild white-tailed deer and captive white-tailed deer populations in Northern Michigan. For the captive site, an anonymous white-tailed deer farm located in northern Michigan was chosen. Within the farm there were three separate enclosures, containing various amounts of both deer and vegetation. The first enclosure was 10,800 ft2 and held 14 deer, some of which were pregnant. The second enclosure was 33,750 ft2 and held 12 deer of various sexes. The third enclosure was 33,750 ft2 and held eight deer, also varying in sex. It was noted that the second and third enclosures had a dense forest area with a dominant composition of coniferous trees. The wild sites consisted of a 1.2 km radius surrounding the University of Michigan Biological Station (45.558698,-84.677630) in Pellston, Michigan and a densely wooded area approximately 7.24 km northwest of the University of Michigan Biological Station.
The main vegetation in this area is Populus grandidentata and Pinus strobus. It is noted that the wild sample sites used were within a hunting sanctuary. The human population density of Pellston, MI is 435.37 p/mi2 (Population of Pellston, MI, 2016), and the population density of the deer was unable to be determined for this area.
Sample collection
Across two sampling sites, a total of 39 white-tailed deer fecal samples were collected and analyzed for principal components, specifically cholesterol, lactic acid, and stable isotopes of carbon and nitrogen. 21 samples were collected from the captive site and 18 samples were collected between the wild sites. While sampling, a GPS was used to map where samples were found and collected.
Weather and temperature were recorded in the chance that these variables affected the data; the setting where the samples were found was also recorded. Each sample was stored in a 15 mL centrifuge tube. To ensure that the chemical components in the samples were preserved and not affected by heat and other factors they were placed in a -20°C freezer, within two hours of collection.
Principal component analysis
After all samples were collected, they were freeze-dried for 24 hours in a vacuum chamber that was cooled to -50°C. After freeze-drying, samples were individually crushed using a mortar and pestle and returned to their respective 15 mL centrifuge tubes. The mortar and pestle were cleaned with methanol between each sample. A solvent of equal parts 99.5% acetonitrile and methanol was made and added to the crushed fecal samples. The samples were first placed in a Fisher Scientific FS60 Ultrasonic Cleaner for 15 minutes, to break up solid particles in the solution. Then placed into a Sorvall ST 40 Centrifuge for 10 minutes at 3800 rpm to separate the solid particles from the liquid solution. The liquid solution was extracted from each sample and put into a corresponding 15 mL centrifuge tube, for later use. All samples were extracted a total of three times. After this extraction process, acetonitrile was added to the 15 mL centrifuge tubes that contained the liquid extraction samples, to put the samples at a common volume. Then extraction samples were placed in the Sorvall ST 40 Centrifuge for ten minutes at 3800 rpm.
To concentrate any remaining solutes left in the extractions, 1500 μl of the scat extraction was removed from the 15 mL centrifuge tubes and placed into a sterile 2000 μl microcentrifuge tube. Then placed into a Savant™ SPD111 SpeedVac™ for 45 minutes. During the final preparation stages, 100 μl of dimethyl sulfoxide and 100 μl of acetonitrile were added to the microcentrifuge tubes. The samples were placed in Fisher Scientific FS60 Ultrasonic Cleaner for one minute to dissolve any remaining loose particles in the solution. 200 μl of acetamide with trimethylchlorosilane was added to each sample before being placed in a Fisher Scientific Isotemp 200 Series 230F Conventional Oven at 50°C for 30 minutes, to allow the reaction to finish. 1500 μl of the solution was transferred into 2000 μl glass vials. These vials were placed into the Thermo AI/AS 1310 Series Autosampler and sent through the Thermo TRACE™ 1310 Gas Chromatograph and the Thermo ISQ™ LT Single Quadrupole GC-MS System, for principal component analysis.
Stable isotopes analysis
The freeze-dried samples were pulverized using a SPEX SamplePrep 8000D Mixer/Mill®. Each sample was returned to its respective 15 mL centrifuge tube and weighed for stable isotope analysis. Samples were analyzed for percent carbon, percent nitrogen, and carbon and nitrogen stable isotopes. The laboratory used “in-house” standards, due to the cost of the certified international materials. Compounds used for the “inhouse” standard include caffeine, acetanilide, and bovine serum albumin, a serum protein derived from cows. The values are certified with the laboratory and the same materials are run alongside the international standards. In the end, there is confidence in the actual isotopic composition of the “in-house” material.
An independent sample t-test of the average percent carbon and nitrogen content and average cholesterol levels was performed, to compare averages between the wild and captive populations. A Mann-Whitney test was used to evaluate average carbon and nitrogen stable isotopes and average lactic acid levels from each population of deer. The standard error used for nitrogen was 0.10 per mil δ15N (versus air). The standard error used for carbon was 0.05 per mil δ13C VPDB (versus Vienna Pee- Dee Belemnite).
Results
Fecal carbon and nitrogen content
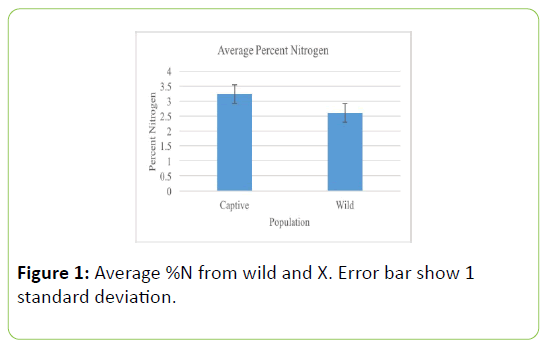
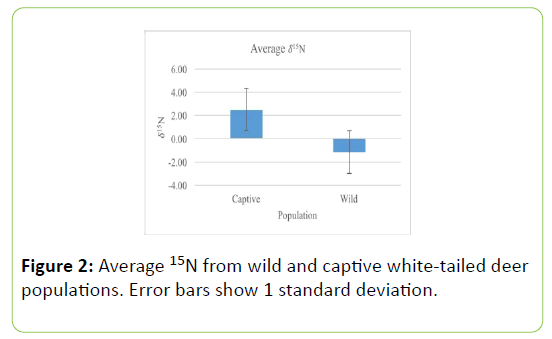
Fecal samples of the captive population of white-tailed deer contained significantly more nitrogen than the wild white-tailed deer population (Table 1; t=-3.487, P=0.001, Figure 1). δ15N values of captive populations were enriched by 3.23 ± 0.25%, relative to wild population δ15N values, showing significant differences. Captive populations have significantly larger average δ15N values (Table 2; U=3.000, P=0.0001, Figure 2).
| Location | Sample Size (ÃÆâÃâââ¬Ãâââ¬Â¹N) | Average %N | t-value | p-value |
|---|---|---|---|---|
| Wild | 18 | 2.61 ± 0.77 | -3.487 | 0.001 |
| Captive | 21 | 3.23 ± 0.25 |
Table 1: Group statistics from independent sample t-test of percent nitrogen values of fecal samples from wild and captive white-tailed deer populations. Values represent means ± 1 standard deviation.
| Location | N | Mean Rank (15N) ÃÆâÃâââ¬Ãâââ¬Â¹ | Average 15NÃÆâÃâââ¬Ãâââ¬Â¹ | U value | p-value |
|---|---|---|---|---|---|
| Wild | 18 | 9.67 | -1.17 ± 1.41 | 3.00 | 0.0001 |
| Captive | 21 | 28.86 | 2.49 ± 0.65 |
Table 2: Group statistics from Mann-Whitney test of 15N values of wild and captive white-tailed deer populations. Values represent means ± 1 standard deviation.
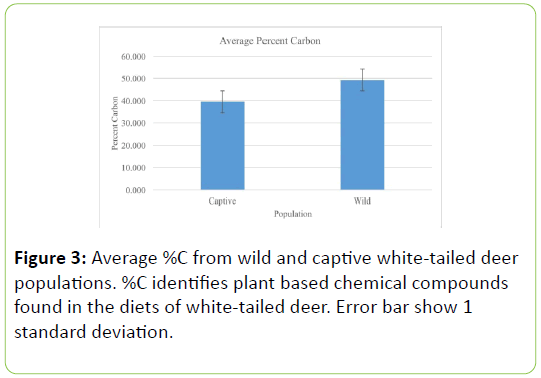
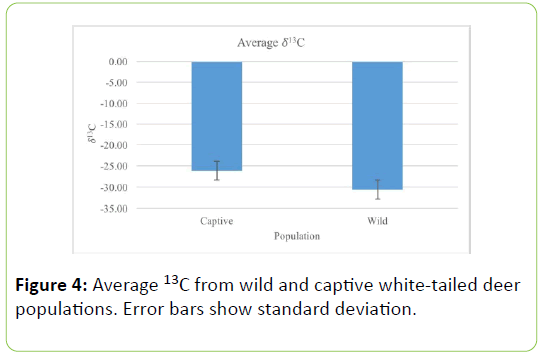
The average percentage of carbon was significantly larger in the wild deer population, as compared to the captive population (Table 3; U=0.000, P=0.0001, Figure 3). Additionally, captive deer populations had significantly lower average δ13C values (Table 4; U=0.000, P=0.0001, Figure 4).
| Location | N | Average %C | U value | p-value |
|---|---|---|---|---|
| Wild | 18 | 49.29 ± 1.67 | 0.00 | 0.0001 |
| Captive | 21 | 39.46 ± 1.94 |
Table 3: Group statistics from Mann-Whitney test and t-test of percent carbon values of wild and captive white-tail deer populations. Values represent means ± 1 standard deviation.
| Location | N | ÃÆâÃâââ¬Ãâââ¬Â¹Mean Rank (13ÃÆâÃâââ¬Ãâââ¬Â¹C) | Average 13CÃÆâÃâââ¬Ãâââ¬Â¹ | U value | p-value |
|---|---|---|---|---|---|
| Wild | 18 | 9.50 | -30.63 ± 0.97 | 0.00 | 0.0001 |
| Captive | 21 | 29.00 | -26.15 ± 0.46 |
Table 4: Group statistics from Mann-Whitney test of 13C values of wild and captive white-tailed deer populations. Values represent means ± 1 standard deviation.
Fecal cholesterol and lactic acid content
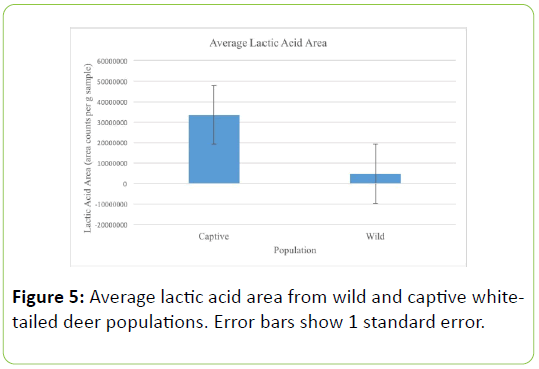
Looking at lactic acid values, the captive deer population had a significantly higher average amount of lactic acid detected, 3.33 x 10⁷ ± 8.94 x 10⁷, compared to the wild population, 4.72 x 10⁶ ± 9.54 x 10⁶ (Table 5; U=76.000, P=0.001, Figure 5).
| Location | N | Mean Rank Lactic Acid Area (area counts/ g sample) | Average Lactic Acid Area (area counts/ g sample) | U value | p-value |
|---|---|---|---|---|---|
| Wild | 18 | 13.72 | 4723077.47 ± 9.54 × 10ÃÆâÃâââ¬Ãâââ¬Â¹6 | 76 | 0.001 |
| Captive | 21 | 25.38 | 33459431.34 ± 8.94 × 10ÃÆâÃâââ¬Ãâââ¬Â¹7 |
Table 5: Group statistics from Mann-Whitney test of lactic acid area values of wild and captive white-tailed deer populations. Values represent means ± 1 standard deviation.
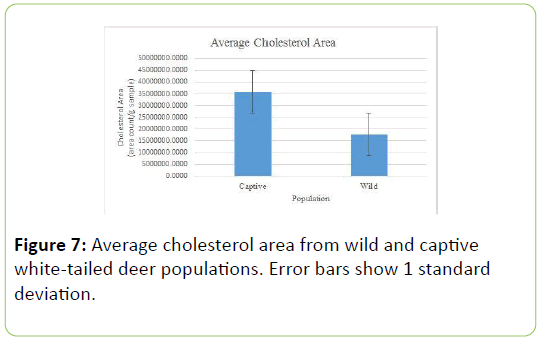
In regard to cholesterol values, the captive deer population had a significantly higher average amount of cholesterol detected, 2.26 x 10⁷, compared to the wild population, 1.77 x 10⁷ (Table 6; t=2.73;P=0.007).
| Location | N | Cholesterol Area (area counts/ g sample) | t-value | p-value |
|---|---|---|---|---|
| Wild | 18 | 17707511.02 ± 12833347.68 | 2.73 | 0.007 |
| Captive | 21 | 22594336.34 ± 31130830.83 |
Table 6: Group statistics from t-test of cholesterol area values of wild and captive white-tailed deer populations. Values represent means ± 1 standard deviation.
Principal component analysis
The principal component analysis identified 201 different components, from the samples. Three significant components were chosen, from both the wild and captive populations, for further analysis. The significant components from the wild population were bilobol (C21H34O2), stigmastanol (C29H52O), and valerenic acid (C15H22O2). The significant components from the captive population were hydrocortisone acetate (C23H32O6), trehalose (C12H22O11), and 1-octacosanol (C28H58O).
Discussion
Diets
The results from the stable nitrogen isotope data revealed that the captive deer population had a significantly larger average δ15N value than the wild deer population. Due to the fact that wild deer consume leaves of small trees and shrubs, which tend to have lower δ15N values than other non-woody plant types, this could explain why wild white-tailed deer populations have a lower average δ15N value [13]. The low values of δ15N found in the wild population could also be a result of browsing on agricultural lands treated with artificial fertilizers, which have lower δ15N values [13]. Nitrogen content has been shown to have a strong association with forage quality, indicating that the captive deer could have access to higher quality forage [14]. Additionally, larger δ15N values are an indication of a higher protein diet, indicating that the captive deer are being fed more protein than they would normally forage on in the wild [15]. Diet quality can be characterized by protein content because nitrogen determines animal growth [14]. Different soils also influence protein levels of vegetation, which could indicate that wild populations are foraging on plants in lower quality soils [16]. Additionally, the captive population was fed a mineral supplement, which could cause higher δ15N values, although further isotope analysis of the mineral supplement would need to be done in order to confirm this prediction.
The stable isotope results also revealed that the captive deer population had significantly lower average δ13C values, as compared to the wild deer population. The δ13C values are expected to reflect the δ13C of the plants in the deer’s diet. C3 plants are significantly depleted in δ13C, compared to C4 plants, in terrestrial environments. Also, the canopy effect in deep forests can greatly decrease the δ13C of the food chain, due to recycling of isotopically light CO2 from plant respiration and decomposition in soil litter, causing the wild deer to have lower δ13C values [13].
Conversely, higher δ13C values are a result of consuming more C4 plants, such as corn [13]. It can be predicted that the captive deer population was being fed a diet with more C4 plants. Further stable isotope tests on the food supplements given to the captive deer population could be analyzed to support this prediction.
The results showed that the captive white-tailed deer population had significantly higher cholesterol levels than the wild white-tailed deer population. This could be a result of the captive deer being fed more saturated fats in their diet, specifically in the supplemental feed fed to the deer. Further tests would need to be analyzed on the supplemental feed, collected from the deer farm, to determine the saturated fat percentages, before making any additional conclusions. The lower cholesterol levels in the wild deer could also be due to seasonal factors. In a previous study, it was found that cholesterol levels in does, were higher in the fall and winter months [17]. This study was conducted in late May, which has different vegetation available to the deer. The length of this study was not long enough to conclude that cholesterol plays a role in the lifespan of wild and captive white-tailed deer.
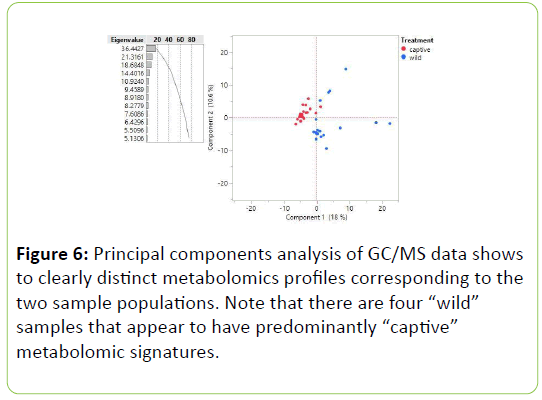
The principal component analysis of GC/MS data shows two clearly distinct metabolomic profiles, corresponding to the wild and captive white-tailed deer populations (Figure 6). Upon analysis, three significant components from both the wild and captive populations were chosen. In the captive deer population, the significant components were bilobol (C21H34O2), stigmastanol (C29H52O), and valerenic acid (C15H22O2).
Bilobol is an irritant found in poison ivy (Toxicodendron radicans), a plant that grows in almost every habitat and is commonly consumed by white-tailed deer in northern Michigan [18]. The high concentration of bilobol found in captive populations could be due to a greater prevalence of poison ivy in the enclosures or a greater preference for it.
Stigmastanol is a phytosterol found in a variety of plant sources. While it is known for its ability to inhibit the absorption of cholesterol, the captive population had higher levels of cholesterol, in comparison to the wild population (Figure 7) [19]. Valerenic acid is found in Valerian plants (Valeriana officinalis), which usually grows in lacustrine habitats [20]. While the captive deer enclosures were not lacustrine habitats, it is possible that Valerian plants were present.
In the wild population, the significant components related to diet were hydrocortisone acetate (C23H32O6), trehalose (C12H22O11), and 1-octacosanol (C28H58O). Hydrocortisone acetate is the synthetic acetate salt form of cortisol, a “stress” steroid hormone [21]. This glucocorticoid is commonly used to assess stress in mammals. The diet consumed by wild deer can have an effect on the cortisol level excreted in the fecal samples [22].
Diet, in itself, can often be a cause of stress in wild populations; on the other hand, diet stress is not usually a concern for captive populations [22]. Trehalose is a mycose sugar that serves as a protectant to many Arabidopsis species. Arabidopsis species found in Michigan are the sand cress (Arabidopsis lyrata) and the mouse-ear cress (Arabidopsis thaliana) [23]. Due to the high concentration of trehalose found in the wild population samples, it can be inferred that whitetailed deer are consuming one or both of these species.
1-Octacosanol is commonly found in the epicuticular waxes of plants, including the leaves of many species of Eucalyptus, of most forage and cereal grasses, of Acacia, Trifolium, and Pisum (“1-Octacosanol”). The high concentrations of 1-octacosanol found in the wild white-tailed deer samples, suggests these deer are consuming a lot of forage in their daily diet.
Overall, knowledge of these six components allows us to make predictions about how the diets of wild versus captive populations differ. Based on the principal components analysis of GC/MS data, wild and captive populations of white-tailed deer in northern Michigan have significantly different diets (Table 7).
| PC1 Highest and Lowest 5 Compounds | ||
| Lowest Compounds | PC1 | PC2 |
| Bilobol C15:1 (2TMS) | -0.44003 | 0.3567 |
| Stigmastanol TMS Derivative - silane, trimethyl | -0.42541 | 0.43823 |
| Valerenic Acid, TMS | -0.39503 | -0.19166 |
| 11-Octadecenoic acid,(E)-,TMS | -0.39173 | 0.35865 |
| Valerenic Acid, TMS 2 | -0.38287 | 0.49086 |
| Highest Compounds | PC1 | PC2 |
| Pimaric Acid | 0.80182 | -0.15343 |
| Isopimaric Acid | 0.81342 | -0.10582 |
| Dehydroabietol cinnamate | 0.82063 | -0.08752 |
| Silane | 0.82534 | -0.21272 |
| 2-(p-(Dimethylamino)phenyl)benzimidazole | 0.90437 | 0.15262 |
| PC2 Highest and Lowest 5 Compounds | ||
| Lowest Compounds | PC1 | PC2 |
| 24-Methylenecycloartan-3-one | 0.25657 | -0.69577 |
| D-(+)-Trehalose,octakis(trimethylsilyl)ether | 0.36113 | -0.61737 |
| 1-Octacosanol, TMS Derivative | 0.52604 | -0.59951 |
| Hydrocortisone Acetate | 0.25303 | -0.52098 |
| beta-Amyrone | 0.09197 | -0.51705 |
| Highest Compounds | PC1 | PC2 |
| Stigmastanol, TMS Derivative | 0.42129 | 0.58939 |
| Stigmastanol- trimethylsiyl ether | 0.65178 | 0.65344 |
| Diosgenin | 0.35412 | 0.66149 |
| Bilobol C15:1 (2TMS) 2 | 0.15747 | 0.69834 |
| Stigmastanol TMS Derivative | -0.13816 | 0.71562 |
Table 7: The GC/MS found over 200 significant chemical compounds in 39 fecal samples. The following table shows five of the highest and lowest principle compounds within two principle tests.
Health
In the wild population, a significant component identified was hydrocortisone acetate (C23H32O6). The high concentration of hydrocortisone acetate found in the wild population could be due to living in a higher stress environment. For example, wild populations must face the stress of scavenging for food and escaping predators daily, while captive populations do not have exposure to this challenge.
It was found that captive deer had a significantly higher average of lactic acid than the wild deer population. The consumption of plants with high secondary compounds contributes to lactic acid accumulation. Secondary compounds are compounds that are not essential for the survival of the plant, however, they can act as a defense mechanism against herbivores [24]. Based on the data, it is possible that captive deer are consuming plants with higher concentrations of secondary compounds [25]. Diets that are rich in secondary compounds can result in metabolic acidosis in herbivores, where excess acid is excreted or buffered to maintain acid-base homeostasis in the deer [25]. Metabolic acidosis is a characteristic found in capture myopathy, which occurs as a result of damage to the skeletal and cardiac muscles after a pursuit, capture, handling, and manipulation of an animal [26]. Even though the captive deer are not exposed to predation, because they were raised in captivity, the higher lactic acid levels found could be due to frequent human interaction. This could affect the overall health of the deer, and as a result, the lifespan of captive deer.
Errors and improvements
Due to the limited time frame while conducting this study, a small sample size for both wild and captive populations was used. Given more time, more samples could have been collected from the wild sites to better represent the wild white-tailed deer population in northern Michigan. Additionally, further sampling at additional deer farms would have allowed the study to make broader conclusions about captive deer enclosures and assess true differences.
The locations selected were quite specific and could also factor into the results. The two wild locations attempted to be located outside of a white-tailed deer’s home range, however, deer are not limited to a defined radius. Thus a mixture of samples from the same herd is possible, regardless of the distance between the two wild sites. The distance between the captive herd and wild herd was not a factor in this study because the captive herd is born and raised in captivity, thus eliminating any possibility of herd interbreeding.
Accuracy in lab prep is a factor for this study. When weighing fecal samples for GC/MS analysis, the weights were recorded for one pellet of each sample, rather than using a consistent weight amongst all samples. The various sample weights could have resulted in mathematical error during the calculation of cholesterol and lactic acid area count per gram sample ratio.
The variable of seasonal food sources could also be addressed, as the data received was primarily spring resources. Cholesterol levels are said to have seasonal fluctuations and the sample collection time does not accredit for these seasonal changes [17].
Conclusion
Based on the fecal analysis of captive and wild populations of white-tailed deer in northern Michigan, it can be concluded that these populations have significantly different diets.
The differences in diet could be attributed to supplementary feed and mineral blocks fed to the captive deer, that wild populations do not consume, as well as differences in forage surrounding the habitats of wild and captive populations. Given the results of this study, it can be inferred that white-tailed deer populations living in captivity consume a higher quality diet than wild populations. The greater nutritional quality of food supplied to captive populations could be a potential reason for the longer lifespan seen in captive populations. In further studies, it would be interesting to use stable isotope analysis to determine the age of each of the samples gathered from the wild and captive populations. Comparing the age of the samples to their predicted diet would help to determine the role that diet plays in lifespan.
Acknowledgements
We would like to thank our General Ecology Professor Jasmine Crumsey-Forde and our Teaching Assistants Corbin Kuntze and Olivia Brinks for their constant feedback and support throughout our project. We would also like to thank UMBS Laboratory Manager Timothy Veverica and the other lab techs for their help in analyzing all of our fecal samples. Additional thanks to Adam Schubel; The Resident Biologist and Sherry Webster; The Stockroom Manager for assisting us in our experimental design and materials. Lastly, we would like to thank the deer farm, in which we collected samples, for giving us permission to analyze samples from their white-tailed deer.
References
- Sargent MS, Carter KS (1999) Landowner’s Guide: White-tailed Deer.
- Rogers LL, Mooty JJ, Dawson D (1981) Foods of white-tailed deer in the upper great lakes region: A Review. https://www.fs.fed.us/nrs/pubs/gtr/gtr_nc065.pdf
- VerCauteren K, Hygnstrom SE (2011) Managing white-tailed deer: Midwest North America. Papers in Natural Resources 37.
- Why Deer Farming? | NADeFA (2018). https://www.nadefa.org/why deer-farming
- Li C, Jiang Z, Tang S, Zeng Y (2007) Influence of enclosure size and animal density on fecal cortisol concentration and aggression in Pere David's deer stags. Gen Comp Endocrinol 151: 202-209.
- Jones P, Strickland B, Demarais S, DeYoung R, Maher C, et al. (2011) Inconsistent association of male body mass with breeding success in captive white-tailed deer. J Mammal 92: 527-533.
- Demarais S, Strickland BK, Webb SL, Smith T, Mcdonald C, et al. (2016) Simulated effects of releasing pen-raised deer into the wild to alter population-level antler size. Wildl Soc Bull 40: 41-49.
- Parker KL, Barboza PS, Gillingham MP (2009) Nutrition integrates environmental responses of ungulates. Funct Ecol 23: 57-69.
- Tripler C, Canham C, Inouye R, Schnurr J (2002) Soil nitrogen availability, plant luxury consumption, and herbivory by white-tailed deer. Oecologia 133: 517-524.
- Lopez RR, Vieira MEP, Silvy NJ, Frank PA, Whisenant SW, et al. (2003) Survival, mortality, and life expectancy of florida key deer. J Wildl Manag 67: 34-45.
- Robinson K, Diefenbach D, Fuller A, Hurst J, Rosenberry C, et al. (2014) Can managers compensate for coyote predation of white-tailed deer? J Wildl Manag 78: 571-579.
- DeWeerdt S (2016) Part Coyote, Part Wolf, Part Dog: Enter the Coywolf; A hybridized canid made up of coyote, wolf and dog genes is expanding across the eastern US Newsweek 166.
- Cormie A, Schwarcz H (1994) Stable isotopes of nitrogen and carbon of North American white-tailed deer and implications for paleodietary and other food web studies. Palaeogeogr Palaeoclimatol Palaeoecol 107: 227-241.
- Gil-Jiménez E, Villamuelas M, Serrano E, Delibes M, Fernández N, et al. (2015) Fecal nitrogen concentration as a nutritional quality indicator for european rabbit ecological studies. PLOS ONE 10: e0125190.
- Robbins CT, Felicetti LA, Florin ST (2010) The impact of protein quality on stable nitrogen isotope ratio discrimination and assimilated diet estimation. Oecologia 162: 571-579.
- Jones P, Demarais S, Strickland B, Edwards S (2008) Soil region effects on white-tailed deer forage protein content. Southeast Nat 7: 595-606.
- Rule DC, McCormick RJ (1998) Fatty acid composition and cholesterol concentration in tissues of white-tailed deer (Odocoileus virginianus) as influenced by lactation, age, and season of the year. Comp Biochem Physiol B Biochem Mol Biol 119: 563-570.
- Jacobs MS, Melymuka M, Bradtke J, Burnham RJ (2013) Toxicodendron radicans | Climbers. University of Michigan.
- Heinemann T, Kullak-Ublick GA, Pietruck B, von Bergmann K (1991) Mechanisms of action of plant sterols on inhibition of cholesterol absorption. Comparison of sitosterol and sitostanol. Eur J Clin Pharmacol 40: S59-S63.
- O’Neal RP, Soulliere G (2006) Conservation guidelines for Michigan lakes and associated natural resources. State of Michigan Department of Natural Resources.
- https://pubchem.ncbi.nlm.nih.gov/compound/Cortell#section=Top
- Keay JM, Singh J, Gaunt MC, Kaur T (2006) Fecal glucocorticoids and their metabolites as indicators of stress in various mammalian species: A literature review. J Zoo Wildl Med 37: 234-244.
- https://michiganflora.net/genus.aspx?id=Arabidopsis
- Liu X, Jia Y, Li N, Gong H, Zhang Y, et al. (2012) Research progress on ways of secondary metabolism in plants. Appl Mech Mater 178: 1004-1007.
- Campbell T, Hewitt D (2000) Effect of metabolic acidosis on white-tailed deer antler development. Physiol Biochem Zool 73: 781-789.
- Blumstein DT, Buckner J, Shah S, Patel S, Alfaro ME, et al. (2015) The evolution of capture myopathy in hooved mammals: a model for human stress cardiomyopathy? Evol Med Public Health 2015: 195-203.

Open Access Journals
- Aquaculture & Veterinary Science
- Chemistry & Chemical Sciences
- Clinical Sciences
- Engineering
- General Science
- Genetics & Molecular Biology
- Health Care & Nursing
- Immunology & Microbiology
- Materials Science
- Mathematics & Physics
- Medical Sciences
- Neurology & Psychiatry
- Oncology & Cancer Science
- Pharmaceutical Sciences
