Assessment of Variability in Yearlong Relative Loose Mineral Intake and Range Cow Productivity in North American Northern Great Plains
Petersen MK, Muscha JM, Roberts AJ
Petersen MK*, Muscha JM and Roberts AJ
USDA-ARS Fort Keogh Livestock & Range Research Laboratory, Miles City, Montana, USA
- Corresponding Author:
- Petersen MK
USDA-ARS Fort Keogh Livestock & Range Research Laboratory
Miles City, Montana, USA
Tel: +14068748213
E-mail: mark.petersen@ars.usda.gov
Received Date: October 10, 2018; Accepted Date: April 03, 2019; Published Date: April 10, 2019
Citation: Petersen MK, Muscha JM and Roberts AJ. Assessment of Variability in Yearlong Relative Loose Mineral Intake and Range Cow Productivity in North American northern Great Plains (2019) J Anim Res Nutr 4: 2: 4. doi:10.21767/2572-5459.100054
Copyright: © 2019 Petersen MK, et al. This is an open-access article distributed under the terms of the Creative Commons Attribution License, which permits unrestricted use, distribution, and reproduction in any medium, provided the original author and source are credited.
Abstract
Background: Appraisal of the effectiveness of supplementary mineral nutrition in grazing range cattle to promote growth and reproduction is lacking due to an inability of methods to measure cause and effect relationships, record variability of grazed diet mineral concentrations, evaluation of cattle presence at mineral feeder, measurement of shifting requirements due to changes in physiological stage and a lack of accurate mineral supplement intake quantification.
Methods and findings: This study evaluated cattle presence at mineral feeder, relative mineral intake and its association with calf Body Weight (BW) at birth and weaning, cow BW change and calving interval (d). Cross-bred cows grazed native range with access to mineral feeders containing 34% salt, 57% macro/microminerals, 9% distillers’ grains and 1% titanium (Ti) as titanium dioxide for sixteen months from August 2010 to November 2011. Motion activated cameras were used to record ear tags of 106 cross-bred cows as their heads approached the open range mineral tub. Mineral feeder tubs were placed near water sources to promote contact of cattle with mineral supply. Rectal fecal samples were collected at 1 or 2-months interval and were analyzed for Ti content. Filtered samples were transferred to 15 ml falcon tubes for Ti analysis using inductively-coupled plasma mass spectrometry analytical technique (USFS Bozeman Fish Technology Center, Bozeman, Montana, USA). It was assumed that fecal Ti was positively related to mineral consumption. Cows were assigned to one of four fecal Ti concentration clusters based on their mean Ti concentration: (1) low (3 to 5 ppm, n=23), (2) mid-low (5 to 6 ppm, n=36), (3) mid-high (6 to 7 ppm, n=26) and (4) high (7 to 11 ppm, n=21). Data were analyzed using Proc Mixed SAS (SAS Inst., Inc., Cary, NC) and a model including Ti cluster and cow age (2 to 11 years) as a covariate. The percent of cows at mineral tub each day differed (p<0.01) by season. In late growing season (July-October), 48 ± 3.9% of herd visited the tub daily compared to 31 ± 3.4% in fall and winter dormancy (November-March) and 27 ± 4.1% during spring growth (April-June). Average consumption based on amount of mineral fed was greatest (p<0.01) during forage dormancy and spring growth (53 ± 3.8 g hd-1 d-1) and lowest during late growing season (38 ± 3.5 g hd-1 d-1). Regardless of fecal Ti concentration, all groups had similar 2011 calf BW at birth (p<0.22) and weaning (p=0.89), cow BW change (2010-2011) p=0.71 and 2010 to 2011 and 2011 to 2012 calving interval (p=0.85). In addition, mean fecal Ti in 18 non-pregnant and 88 pregnant cows were 6.22 ppm and 5.95 ppm (p=0.68), indicating no differences in mineral consumption between non-pregnant and pregnant cows.
Conclusion: During the late growing season, cow activity at a mineral tub was highest but mineral disappearance from the tub was the lowest. Range in mean fecal Ti of individual cows represented a 3-fold divergence in Ti dilution indicating a magnitude difference in mineral consumption. If mineral consumption was a primary production limitation in the year of this study, then differences would be expected for the production traits evaluated influenced by predicted mineral intake.
Keywords
Mineral; Intake; Range cattle; Titanium
Introduction
Factors influencing voluntary loose mineral consumption have been subject to speculation. Range cattle managers expect supplementation of deficient minerals to improve forage utilization and animal production. However, few studies have assessed mineral consumption and association with range cow productivity in an extensive grazing setting [1]. Aspects of the environment including season of the year, water salinity, daily temperature, salt bush frequency, forage maturity, vegetation dry matter content and other factors have been suggested as important contributors to variability in mineral intake [2]. Few studies have investigated the relationships between mineral intake, environmental changes that occur over a year and cowcalf responses. Understanding of seasonal associations with cattle use of mineral feeders and individual intake variability should allow for development of practices to better insure realization of targeted consumption to promote animal productivity. This study was designed to evaluate the effect of variability in herd mineral intake due to season on cow and calf body weight change and reproductive success.
Methods
This study was conducted at the USDA-ARS Fort Keogh Livestock and Range Research Laboratory near Miles City, MT (46°22′ N 105°5′ W) for 16 months from August 2010 through November 2011. Native vegetation on the 22,500-ha research station consists of a grama-needlegrass-wheatgrass (Bouteloua- Stipa-Agropyron) mix. Average annual forage standing crop at the study site is 870+14 kg/ha [3]. The long-term average precipitation is 343 mm with about 60-70% occurring during the mid-April through mid-September growing season at an average elevation of 730 m. Regional topography ranges from rolling hills to broken badlands, with small intersecting streams that flow into large permanent rivers meandering through broad, nearly level valleys. Climate is continental and semi-arid. Average daily temperatures range from −10°C in January to 24°C in July; daily maximum temperatures occasionally exceed 37°C during summer, and daily minimum temperatures occasionally fall below −40°C during winter. All procedures were approved by the laboratory Animal Care and Use Committee (ACUC No. 011116-1). One hundred and six cross-bred cows grazed native range with access to rubber mineral tubs containing 34% salt, 57% macro and microminerals, 9% distillers’ grains (as an attractant) and 1% titanium as titanium dioxide (Ti) from August 2010 to November 2011 (Table 1).
| Item | |
| Ingredient | % |
| Dicalcium phosphate | 36.5 |
| Salt | 37.6 |
| Potassium chloride | 11.7 |
| Magnesium oxide | 10.2 |
| Ruminant trace mineral pack | 1 |
| Mineral oil | 0.5 |
| Copper chloride | 0.24 |
| Vit A 650/KIU/g | 0.04 |
| Nutrient composition | |
| Calcium | 7.2 |
| Phosphorus | 8 |
| Potassium | 6 |
| Chloride | 28.4 |
| Magnesium | 6 |
| Sodium | 14.9 |
| Sulfur | 0.41 |
| ppm | |
| Iron | 1160 |
| Manganese | 1004 |
| Copper | 2000.o |
| Selenium | 21.4 |
| Zinc | 2000.o |
| Iodine | 53 |
| Cobalt | 10 |
| 1,000 IU/kg | |
| Vitamin A | 120 |
Table 1: Ingredient and nutrient composition of mineral supplement (all units as fed).
Target intake was 60g hd-1 d-1. Ti was added to the mix to serve as a fecal marker in the mineral mix consumption to predict relative mineral consumption over the course of the study. Salt and inorganic mineral presented to livestock in rubber tub feeders was available for consumption continuously. Quantities of mineral mix were recorded at the time of addition to tub. Weight loss of mineral mix was assumed to be due to consumption by cows. Possible other means of mineral mix weight reduction could have been due to wind, rain or consumption by wildlife. However, these means were ignored. Disappearance of mineral was summarized in each phenological season for grass growth denoted as winter corresponding to dormancy, Spring consistent with new growth and Summer relating to seed head formation and set.
Bushnell Trophy Cam XLT™ motion activated trail cameras were fitted on a livestock panel to record daily cow appearance at mineral tubs. Cows could access the tubs from one direction. Panels were placed around tubs to restrict directional approach. Images were reviewed by a trained technician and recorded and categorized by phenological season of year and cow presence at feeder by individual identification ear tag that was documented in the digital image.
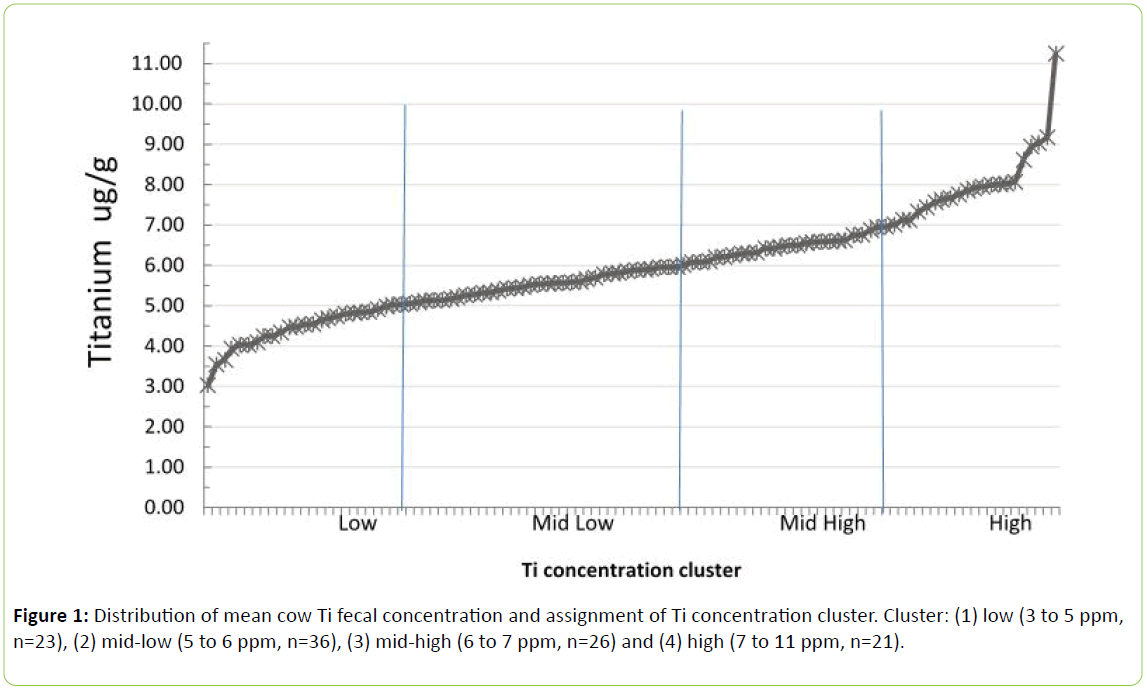
A potential of twelve rectal fecal samples were collected at 1 or 2-months interval for each cow over a 16-months period and analyzed for Ti content. It was assumed that mean concentration of fecal Ti was positively associated with mineral consumption. Within 4 hours after collection, fecal samples were placed and dried at 60°C in a forced air oven. Samples were ground through a 1 mm screen using a Wiley mill. Two grams of each fecal sample was weighed into 50 ml tubes. Ten ml of 70% nitric acid was added to each tube. Tubes sat overnight under a laboratory hood and then placed in a heat block at 95°C for 7 hours. Tubes were monitored to keep 10 ml of nitric acid from bubbling out of tube tops. Tubes sat overnight in hood to cool. Samples were diluted with 40 ml of MQ water. Each sample was vortexed and filtered using a 0.45-micron filter with vacuum. The filtered sample was transferred to 15 ml falcon tubes for analysis using inductively-coupled plasma mass spectrometry analytical technique [3] (USFS Bozeman Fish Technology Center, Bozeman, MT). Mean Ti concentrations of fecal samples (n ≤ 11) for each cow were ranked within the herd for Ti concentration. Based on mean Ti concentrations, cows were assigned to one of four fecal Ti concentration clusters: (1) low (3 to 5 ppm, n=23), (2) mid-low (5 to 6 ppm, n=36), (3) mid-high (6 to 7 ppm, n=26) and (4) high (7 to 11 ppm, n=21) (Figure 1).
Various production measurements were recorded during the 16-months experiment. These measurements included; calf birth weight 2010, calf birth weight 2011, calf birth weight 2012, calf weaning BW 2010, calf weaning BW 2011, cow BW change (Aug 2010 to Nov 2011), calving interval d 2010-2011 and calving interval d 2011-2012. Mineral intake and cow and calf production data were analyzed as a completely randomized arrangement of treatments using the MIXED procedure of SAS (SAS Institute, Cary, NC) with cow as the experimental unit. The model to analyze production responses included Ti clusters and cow age (2 to 11 years) as a covariate. The model for mineral intake included 3 vegetative phenological seasons. Significance was determined at p<0.05.
Results and Discussion
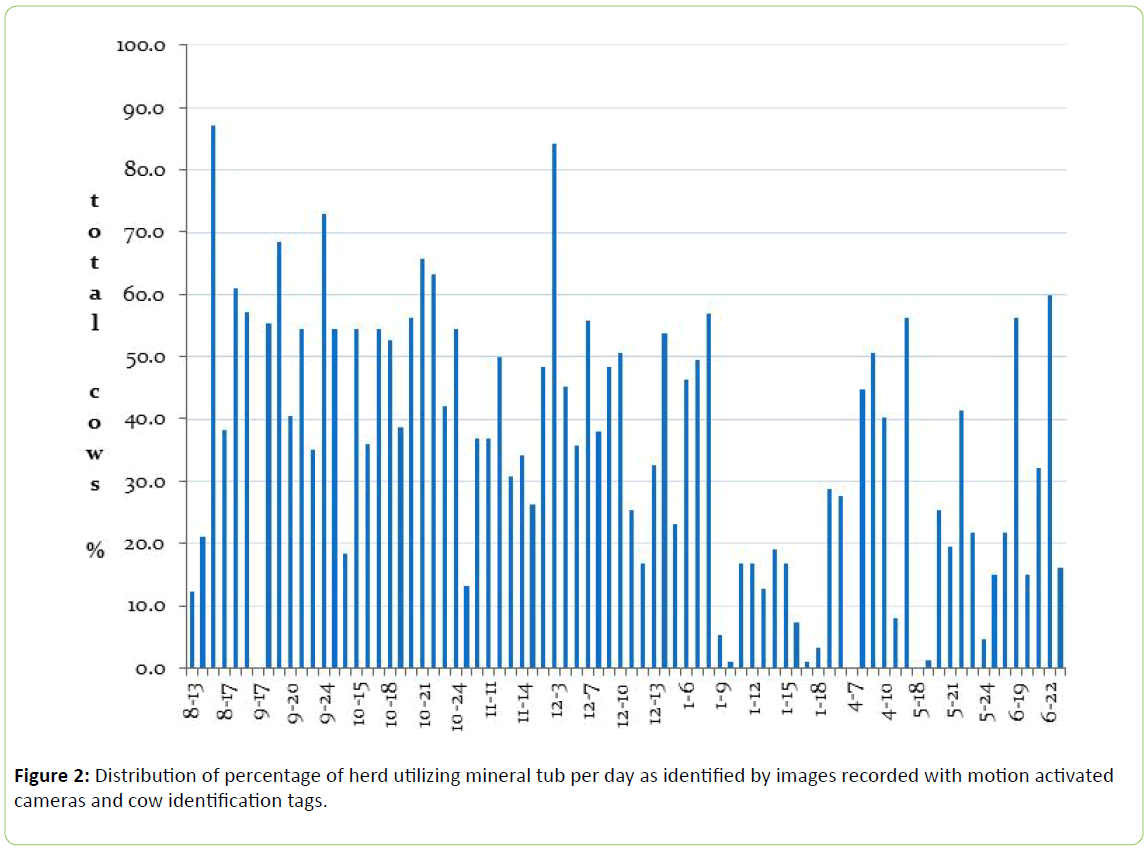
Daily cow presence as a percentage of herd at the mineral tub was highly variable (range=0 to 87%) (Figure 2).
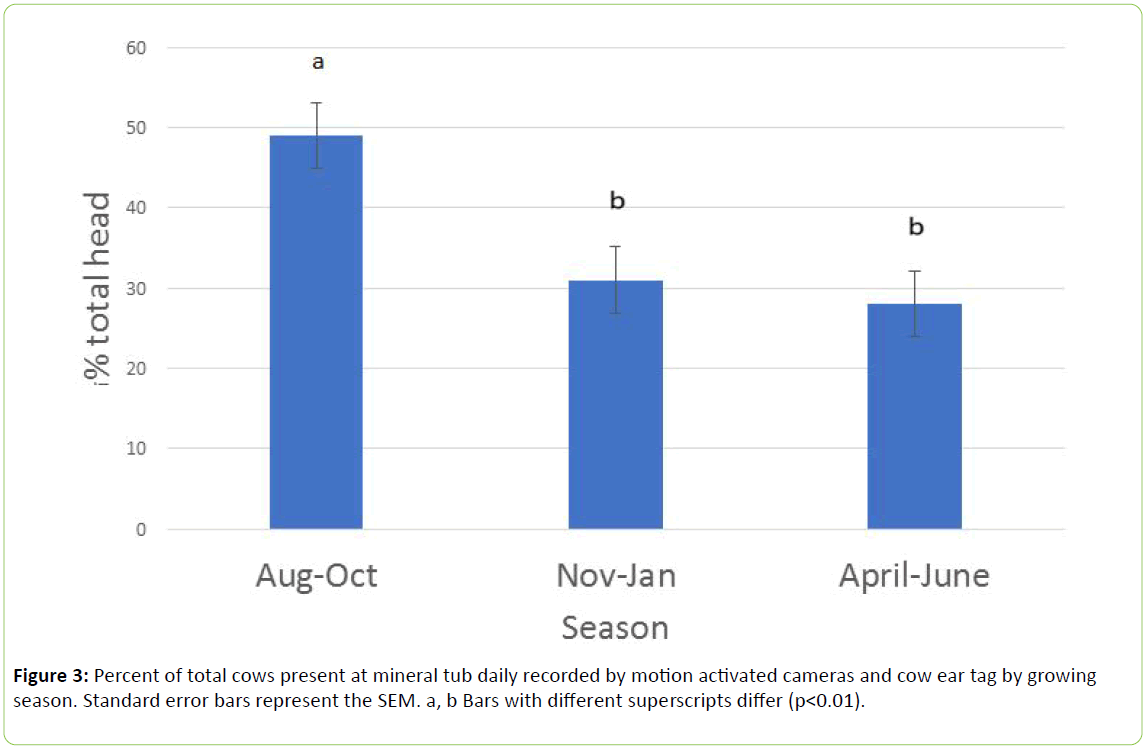
The percent of cows at mineral tub each day differed (p<0.01) by season (Figure 3).
In late growing season (July-October), 48 ± 3.9% of herd visited the tub daily compared to 31 ± 3.4% in fall and winter dormancy (November-March) and 27 ± 4.1% during spring growth (April-June). There was a positive (p<0.01, r=0.28) relationship between daily high temperature and frequency at tub (data not shown). We speculate that the higher visitation rate during high temperature days could be due the proximity of the tubs to water sites and to a greater incidence of water consumption, more social time spent loafing by the mineral tub and longer day length allowing for additional daylight hours to graze reducing urgency to depart water site. Even though cows visited the tub most frequently during the late summer season mineral consumption was the lowest (p<0.01). We can speculate that the lower consumption of mineral is due to a replacement of sodium chloride in their diet supplied by the self-fed mineral (in seasons November-March and April-June) by water total dissolved solids (especially sodium) found in developed water sources especially pumped ground water. We speculate increased water consumption prompted by elevated daily high temperatures in the dry late summer season [4] reduced appetite for sodium available in the mineral mix.
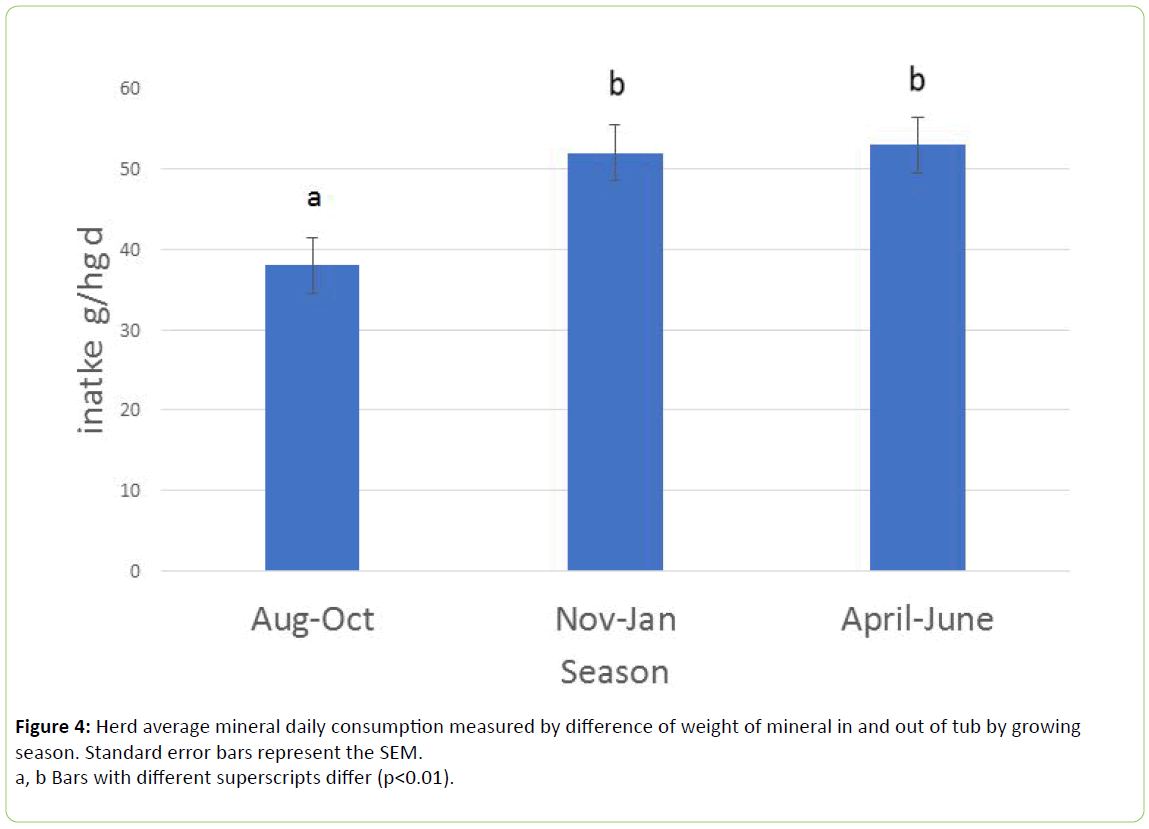
Average consumption of mineral in all seasons was less than the target amount of 60 g hd-1 d-1. When developing mineral supplements and no historical measures of consumption exists, practioneers commonly anticipate an intake amount of 60 g per day of a 30 to 50% sodium chloride mineral adjusted to local conditions [5]. Based on amount of mineral weighed into feeding tubs the greatest consumption occurred (p<0.01) during forage dormancy (winter) and spring growth and lowest during summer late growing season (Figure 4).
Water consumption is low in winter [6] minimize water sodium consumption and water sodium concentration is lower in spring [4] allowing for sodium appetite to be extinguished by consumption of sodium in the salt mineral mix. The amount of mineral consumption in the late growing season was likely inflated since calves were observed loafing around mineral feeder tub and were likely consuming small amounts of mineral. Our methods did not allow for differential measurement of mineral disappearance attributed to calves or cows. The range in mean fecal Ti attributed to mineral consumption by individual cows represented a 3-fold difference in Ti dilution likely indicating variation in mineral consumption (Figure 1). However, during the months that this study was conducted it is possible that the yearly variation (i.e. above normal precipitation) may have reduced intake responses to mineral that may occur in normal or less than normal rainfall years. High moisture years will decrease dry matter content of grazed vegetation elevating indirect water consumption and increasing the accumulation of standing water in low elevation sites in pastures to increase random access to water for consumption likely increasing water availability for drinking. These two factors likely reduced travel to and appearances at developed water sites and simultaneously reduced opportunities to access the mineral tub located in close proximality to water.
Chladek and Zapletal [7] measured intake of self-fed mineral with varying proportions of calcium:phosphorus and sodium chloride with all formulas available concurrently and reported intakes at nearly half of what we found (28.1 ± 4 to 24.6 ± 3.1 g hd-1 d-1) with lower consumption in winter unlike our results. Another study conducted in Alberta investigated relative intake of a self-fed mineral with 10 and 22% NaCl inclusion [8]. Their formula was designed for 100 g hd-1 d-1 consumption however cattle surpassed the target consuming 241 to 183 ± 31.4 g hd-1 d-1 for 10% and 22% salt formula respectively reporting much higher intake than our results. In addition, they reported that approximately 60% of the cattle visited the mineral feeder during the study with a range of 29 to 18% of the cattle visiting the feeder on any day similar to the results reported here.
Despite this large range in fecal Ti concentrations and subsequent differences in assumed mineral consumption, all fecal Ti concentration groups had similar (p<0.22) production outcomes for 2011 calf BW at birth and weaning, cow BW change (2010-2011) and 2010 to 2011 and 2011 to 2012 calving interval. This suggests that relative differences in mineral intake had no measurable impact on weight gains or time to pregnancy after calving (Table 2).
| Ti Fecal Concentration Cluster Group | ||||||
|---|---|---|---|---|---|---|
| Item | 1† | 2 | 3 | 4 | SEM | p-value |
| Calf Birth Weight 2010, kg | 36.1 | 38.1 | 34.1 | 36.9 | 2.6 | 0.06 |
| Calf Birth Weight 2011, kg | 36.7 | 38.1 | 38.2 | 33.9 | 2.8 | 0.09 |
| Calf Birth Weight 2012, kg | 39 | 36 | 37.1 | 34 | 3 | 0.14 |
| Calf Weaning Weight 2010, kg | 243.7 | 241.2 | 233.6 | 229.2 | 16.4 | 0.56 |
| Calf Weaning Weight 2011, kg | 241.5 | 236.5 | 221.5 | 218.2 | 14.8 | 0.06 |
| Cow Body Weight Change Weaning 2010 to weaning 2011, kg | 7.8 | 2.5 | 5.8 | 13.4 | 20.2 | 0.86 |
| Calving Interval 2010-2011, days | 365.78 | 362.6 | 362.9 | 368.7 | 3.4 | 0.66 |
| Calving Interval 2011-2012, days | 363.17 | 354.1 | 367.4 | 370.8 | 10.2 | 0.62 |
Table 2: Cow body weight change, calf body weight at birth and weaning and calving interval (2010 to 2011, 2011 to 2012) in cows
consuming different amounts of self-fed mineral as designated by fecal Ti concentration cluster groups.
†Cluster group 1 low (3 to 5 ppm Ti, n=23); cluster group 2 mid-low (5 to 6 ppm Ti, n=36); cluster group 3 mid-high (6 to 7 ppm Ti,
n=26) and cluster group 4 high (7 to 11 ppm Ti, n=21).
In addition, mean fecal Ti concentrations in 18 non-pregnant and 88 pregnant cows were 6.22 ppm and 5.95 ppm (p=0.68), respectively, indicating no differences in fecal Ti or relative mineral consumption suggesting reproductive success was not impacted by mineral intake. It has been suggested [9] the surest diagnosis of health or performance limiting deficits in mineral supply is provided by responses to specific additions to supply. The mineral provided to the cows in this study was specifically formulated to address deficiencies [8,10]. Since we found no differential productivity responses in cows or their calves related to the assigned fecal Ti cluster we can conclude that the amount of mineral consumed was not a limiting determinant of productivity.
Intakes of free-choice mineral mixtures by grazing cattle are highly variable and likely not related to mineral requirements [11]. Coppock et al. [12] measured individual daily consumption of dicalcium phosphate by lactating dairy cows and found individual variation to be large, ranging from 0 to more than 1000 g per head daily. Studies conducted in Florida [13], in Oregon [14] and Lethbridge, Canada [15], showed monthly variation in the consumption of mineral mixtures by cattle.
Others [16] have reported few production (p< 0.01) responses with the exception to artificial insemination with no other differences (p ≥ 0.15) in cow BW or body condition score from initiation of the study to calving and from AI to weaning or for measurements of calf BW at birth, average daily gain, and age adjusted weaning BW (p ≥ 0.15). Improved reproductive performance was reported [17] in dairy cows supplemented with self-fed organic minerals over cows given no mineral supplementation. While Stanton et. al. [18] utilized 300 Angus cows in a 209d trial that started a self-fed mineral program prior to calving where cows were supplemented with three self-fed mineral treatments, a low level inorganic mineral supplement, a high-level inorganic supplement, and a high-level organic supplement. Cows on the high level of inorganic minerals lost more weight (p<0.05) than other treatments. Calf gain was greater (p<0.05) among the cows in the high level of organic supplementation. Cattle in the organic mineral treatment also exhibited better pregnancy rates to AI (p<0.05) than the other two treatments, but overall pregnancy rates did not differ. Whereas [19] another study utilizing free-choice mineral feeders to provide: (1) Macro minerals and organic micro minerals, (2). Macro minerals and inorganic micro minerals and (3). No micro minerals. Results indicated that supplementation and source of trace minerals affected kilograms of calf weaned per cow exposed in grazing beef cows. Supplementation also improved pregnancy rate to AI compared with cows not supplemented with micro minerals for over 1 year. It was concluded that production responses to mineral intake are variable and differences could be due to the year a study is conducted rather than a specific mineral nutrition strategy. In a study [20] with grazing steers in 2 ha paddocks that were supplied with loose mineral had variable consumption between 96.3 and 85.4 g hd-1 d-1 and reported no significant correlations (p>0.05) between steer ADG, temperature, or rainfall and mineral consumption. These authors reported steer attendance at the mineral feeder appeared to be related to intensity of daylight and daily temperatures.
Conclusion and Implications
During the late growing season, higher observed cow activity at a mineral tub was not indicative of higher rates of consumption. Accurate assessment of mineral intake and management of the factors influencing mineral nutrition in range cattle is complicated. Herd mineral consumption during the winter and spring was 12% less and in summer 37% less than the target amount. However individual intake, as predicted by the range in fecal Ti, was nearly 3-fold different from the lowest to highest consumer suggesting some animals ate mineral in excess while others were short of target amount. If mineral deficiency limited cow productivity in this environment then, we would have predicted lower productivity in those cows that were found to have the lowest concentration of marker in their feces. However, we found no relationship with fecal Ti and productivity demonstrating that in the year this study was conducted the least amount of mineral consumed provided for similar productivity compared to cows with higher Fecal TI or assumed mineral intake.
Acknowledgments
Brook Shipp and Susie Reil for their expertise assistance in the laboratory and in the field.
Competing and Conflicting Interests
No competing interests exist
References
- Underwood EJ, Suttle NF (1999) The mineral nutrition of livestock. (3rd Ed.) CABI Publishing, New York.
- Tait RM, Fisher LJ (1996) Variability in individual animal's intake of minerals offered free-choice to grazing ruminants. Anim Feed Sci Technol 62: 69-76.
- Anderson KA (1996) Micro-digestion and ICP-AES analysis for the determination of macro and micro elements in plant tissues. At Spectrosc 17: 30–33.
- Petersen MK, Muscha JM, Mulliniks JT, Roberts AJ (2016) Water temperature impacts water consumption by range cattle in winter. J Anim Sci 94: 4297-4306.
- Petersen MK, Muscha JM, Mulliniks JT, Waterman RC, Roberts AJ, et al. (2015) Sources of variability in livestock water quality over 5 years in the Northern Great Plains. J Anim Sci 93: 1792-801.
- Chládek G, Zapletal D (2007) A free-choice intake of mineral blocks in beef cows during the grazing season and in winter. Livest Sci 106: 41-46.
- Cockwill CL, McAllister TA, Olson ME, Milligan DN, Ralston BJ, et al. (2000) Individual intake of mineral and molasses supplements by cows, heifers and calves. Can J Anim Sci 80: 681–690.
- Grings EE, Short RE, Klement KD, Geary TW, MacNeil MD, et al. (2005) Calving system and weaning age effects on cow and preweaning calf performance in the Northern Great Plains. J Anim Sci 83: 2671–2683.
- Suttle NF (2000) Underwood memorial lecture- minerals in livestock production. Asian-Aus J Anim Sci 13: 1-9.
- NRC (2000) Nutrient requirements of beef cattle. (8th Edn.). National Academy Press, Washington, DC.
- McDowell LR (1985) Nutrition of grazing ruminants in warm climates. Academic Press, New York.
- Coppock CE, Everett RW, Merrill WG (1972) Effect of ration on free-choice consumption of calcium-phosphorus supplements by dairy cattle. J Dairy Sci 55: 245-256.
- Cunha TJ, Shirley RL, Chapman HL, Ammerman CB, Davis GK, et al. (1964) Minerals for beef cattle in Florida. Fla Agric Exp Sm Bull 683.
- Weber DW, Dill TO, Oldfield JE, Frobish R, Vandebergh K, et al. (1992) Daily intake of free-choice salt and protein blocks by beef cows was highly variable. Prof Anim Sci 8: 15-20.
- Rode LM, Beauchemin KA, (1993) Cattle am poor judges of their mineral needs. Weekly Letter, Agriculture Canada No. 3082, Lethbridge, Canada.
- Mundell LR, Jaeger JR, Waggoner JW, Stevenson JS, Grieger DM, et al. (2012) Effects of prepartum and postpartum bolus injections of trace minerals on performance of beef cows and calves grazing native range. Prof Anim Sci 28: 82–88.
- Manspeaker JE, Roble MG, Edwards GH, Douglass LW (1987) Chelated minerals: Their role in bovine fertility. Vet Med 82: 951- 956.
- Stanton TL, Whittier JC, Geary TW, Kimberling CV, Johnson AB (2000) Effects of trace mineral supplementation on cow-calf performance, reproduction, and immune function. Prof Anim Sci 16: 121-127.
- Ahola JK, Baker DS, Burns PD, Mortimer RG, Enns RM, et al. (2004) Effect of copper, zinc, and manganese supplementation and source on reproduction, mineral status, and performance in grazing beef cattle over a two-year period. J Anim Sci 82: 2375-2383.
- Manzano RP, Paterson J, Harbac MM, Lima Filho RO (2012) The effect of season on supplemental mineral intake and behavior by grazing steers. Prof Anim Sci 28: 73–81.

Open Access Journals
- Aquaculture & Veterinary Science
- Chemistry & Chemical Sciences
- Clinical Sciences
- Engineering
- General Science
- Genetics & Molecular Biology
- Health Care & Nursing
- Immunology & Microbiology
- Materials Science
- Mathematics & Physics
- Medical Sciences
- Neurology & Psychiatry
- Oncology & Cancer Science
- Pharmaceutical Sciences
