Growth Efficacy and Nutrient Assimilation of Black Soldierfly and Fish Meal in Diet of Clarias gariepinus (Buchell 1822) Fingerlings
Ayofe M Hammed1, Albert O Amosu2*, Theophilus F Sunnuvu3, Olufemi O Joseph2, Lucas O Dalmeida2 and Oluwajuwon A Fasasi1
1Department of Fisheries, Lagos State University, Lagos, Nigeria 2Department of Agricultural Science, Lagos State University of Education, Lagos, Nigeria 3Department of Aquaculture and Fisheries Management, Lagos State University of Science and Technology, Lagos, Nigeria
Published Date: 2023-05-15DOI10.36648/2572-5459.8.4.076
Ayofe M Hammed1, Albert O Amosu2*, Theophilus F Sunnuvu3, Olufemi O Joseph2, Lucas O Dalmeida2 and Oluwajuwon A Fasasi1
1Department of Fisheries, Lagos State University, Lagos, Nigeria
2Department of Agricultural Science, Lagos State University of Education, Lagos, Nigeria
3Department of Aquaculture and Fisheries Management, Lagos State University of Science and Technology, Lagos, Nigeria
- *Corresponding Author:
- Albert O Amosu
Department of Agricultural Science,
Lagos State University of Education, Lagos,
Nigeria,
E-mail: amosuao@lasued.edu.ng
Received date: April 13, 2023, Manuscript No. IPJARN-23-16348; Editor assigned date: April 17, 2023, PreQC No. IPJARN-23-16348 (PQ); Reviewed date: May 01, 2023, QC No. IPJARN-23-16348; Revised date: May 08, 2023, Manuscript No. IPJARN-23-16348 (R); Published date: May 15, 2023, DOI: 10.36648/2572-5459.8.2.076
Citation: Hammed AM, Amosu AO, Sunnuvu TF, Joseph OO, Dalmeida LO, et al. (2023) Growth Efficacy and Nutrient Assimilation of Black Soldierfly and Fish Meal in Diet of Clarias gariepinus (Buchell 1822) Fingerlings. J Anim Res Nutr Vol. 8 No.2: 076
Abstract
Growth performance and nutrient assimilation of Clarias gariepinus fingerlings fed different levels of Black Soldier Fly (BSF), Hermitia illucens and Fishmeal (FM) for twelve (12) weeks was conducted to develop a low-cost balanced fish diet. Six isonitrogenous crude protein diets were formulated, where BSF replaced FM at 0%, 20%, 40%, 60%, 80% and 100% inclusions. Fingerlings were fed twice daily at 4% body weight and subjected to growth performance and nutrient utilization analysis using indices such as Weight Gain (WG), Percentage Weight Gain (%WG), Feed Conversion Ratio (FCR), Gross Feed Conversion Ratio (GFCR), Protein Intake (PI), Protein Efficiency Ratio (PER) and % survivability. Results revealed that the highest cumulative weight gain (6.28 ± 3.23) was recorded in fingerlings fed 40% BSF diet inclusion, while the lowest (3.94 ± 0.82) was observed in the 0% BSF diet inclusion. There were no significant differences (p>0.05) in protein intake and percentage survivability, while there were significant differences (p<0.05) in weight gain, percentage weight gain, feed conversion ratio, gross feed conversion ratio and protein efficiency ratio. This study indicates that 40% BSF inclusion appear to be suitable in the diet of African catfish, C. gariepinus.
Keywords
Black soldier fly; Clarias gariepinus; Diet; Fishmeal; Growth performance; Nutrient; Protein
Introduction
Aquaculture is an enterprise that is growing rapidly and improving the economy worldwide. Fish are sources of food and revenue for the growing human population, restocking of streams, lakes and rivers to curb the shortage due to the decline in the wild capture and for sport fishing [1-3]. Fish is easily digestible, has ability to prevent and manage heart disorders and neurological diseases [4]. Consumption of fish by humans has being recommended for its role in prevention of heart disease [5]. The protein content of fish is also of immense nutritional value to pregnant women for proper development of the fetus and prevention of abortion. Fish oil enhances the proper mental development and immunity against disease among growing children [5]. Reports shows that fish provide relief from malnutrition, especially in developing countries. Fish flesh is tasty and highly digestible and it increases life expectancy [6]. Aquaculture aims at production of fish to provide protein in the diet [7]. It is man’s most important single source of high quality protein, providing approximately 16% of the animal protein consumed by the world’s population. The internal organs of fish are also an excellent source of specialized enzyme [8]. Cook, et al., [9] reported that optimal physical, cognitive and emotional development and function in humans requires access to food of adequate quantity and quality at all stages of the lifespan.
The global aquaculture fish production rose from 7% in 1973 to more than 30% in 1997 [10]. In 2010, global aquaculture production reached 79 million tons, growing at an annual rate of 9.7% since 1998 [11]. However, aquaculture global fish production stood at 66.6 million tons in 2012 [12]. In 2014, world aquaculture production of fish accounted for 44.1% of total production from capture fisheries and aquaculture up from 42.1% in 2012 [8] and amounted to 73.8 million tons [13]. In 2015, global aquaculture production reached 106 million tons of live weight growing at an average annual rate of 6.6% since 1995 [14]. In sub Saharan Africa, aquaculture growth during 2001-2015 was averaged at 10.4%. In Nigeria, the last few years has witnessed spectacular growth in aquaculture due to spurred interests of many people in fish farming and this will continue to play an increasingly important role in meeting the demand for fish [15]. Most fish production in Nigeria is realized from pond based, tanks and water re-circulatory culture systems using polyculture farming techniques. However, the bulk of high-value fresh and brackish water finfish in these parts of the world are produced by intensive farming systems using inputs in the form of nutritionally complete formulated diets [16]. According to Heindl [17] about 8 million tonnes of fish are produced in China alone with the use of mixed or manufactured feed. While Fagbenro, et al., [18] reported about 0.46 million tonnes of fish was produced in Nigeria by using artificial diet.
One of the prominent species that have been successfully cultured in Nigeria is C. gariepinus [19]. It has a high growth rate, omnivorous feeding habit, high feed conversion rate and hardness, including its high resistance to handling and stress [20,21]. It is mostly used as an experimental fish since it possess necessary breathing organs which enables them to tolerate adverse aquatic and environmental conditions where other cultivated fish species cannot survive [22,23]. C. gariepinus exhibits considerable growth variation both under artificial culture and in the wild. The causes of such variation are seldomly not clear, although it has been suggested that inherent differences in feeding behaviour may contribute to this variation [24,25].
Amino acids play an important function as building blocks of proteins and are mainly obtained from proteins in diet and the quality of dietary protein is assessed from essential to nonessential amino acid ratio [26,27]. Fish feed is considered good if well accepted by fish, has high digestibility, easily available and is cost effective [28]. Good quality fish feed should contain all nutritional content supplied in their correct proportions [29]. The demand for alternative protein source in fish feed therefore, has become more prominent [30].
The aim of formulating good fish feeds is to attain utmost protein deposition and growth within least inputs of feed at a lowest cost. Experimental fish feeds can either be whole or supplemental. Whole diets provide all the nutrients essential for optimum growth and health of fish when reared in bulk in tanks and ponds. The main cost-effective source of protein for fish is plants and animals. Animal proteins are advanced compared to plant proteins since they have all essential amino acids and are readily digestible but costly. Traditional farmed ingredients have increased the processing of the feeds, hence has influencing success of aquaculture [31]. Supplemental diets are intended to sustain the ordinary food usually accessible to fish in ponds or outdoor cages. In fish farming nutrition is critical because feeds represent 50%-60% of production cost [32].
The development of natural and traditional aqua feeds like, termites, black soldier fly larvae, desert locusts, cockroaches and polychaetes have been used either as fish bait, wild fish food or supplementary diets in animal feeds [31,33] but without much research on their nutritional content. Fish farming management aims at attaining utmost fish biomass within a specific time frame [34]. Competition for protein for fish feeds in aquaculture with human and other livestock needs is a major challenge in the aquaculture industry. The high demand for protein based feeds points to the need for innovative ways of developing quality fish feeds for aquaculture to become tenable [23]. Studies have shown that insects such as termites, desert locusts, cockroaches, black soldier fly larvae (Figure 1) and worms such as polychaetes have high nutritional value in terms of proteins, fatty acids and mineral salts.

Figure 1: Life stages of black soldier fly Hermetiaillucens, A: Adult; B: Eggs; C: Larvae; D: Pupae.
Materials and Methods
Study area
The study was carried out on Lagos State University, (LASU). The LASU Fish Farm situated in Faculty of Science, Lagos State University, Ojo, Lagos State, Nigeria lying between 6°26''N and 3°12'E.
Collection of fish samples
total of Three hundred and sixty C. gariepinus fingerlings of average body weight 5.95 ± 0.5, were purchased from Sej. Farm ventures in Badagry, Lagos, Nigeria, transported to LASU fish farm, kept in a concrete tank for acclimatization and starved for 24 hrs to empty their guts in preparation for the experiment.
Experimental design
The experiment was carried out for twelve weeks. The fish were stocked into 18 labelled bowls and stocked with 20 pieces of fingerlings of known weight. The experiment was designed for six isonitrogenous diets, each with three replicates. Each treatment was fed different diet composition. The differences in feeds formulated lied in the percentage composition of fishmeal and black soldier fly. The feed was administered twice daily ad libitumly at 4% body weight, while weight changes were noticed and measured weekly.
Determination of growth performance and nutrient utilization
The weight data recorded were used to calculate Mean Weight Gain (MWG), Percentage Weight Gain (PWG), Specific Growth Rate (SGR), Feed Conversion Ratio (FCR), Gross Feed Conversion Ratio (GFCR), Protein Intake (PI), Protein Efficient Ratio (PER) and percentage survivability following the method of Fashina-Bombata, et al.,; Hammed, et al.,; Hammed, et al., [35-37].
Weight Gain (WG)
The Weight Gain (WG) was calculated as: WG (g)=Wf -Wi;
Where Wf is the final fish body average weight (g), Wi is the initial fish body average weight (g).
Percentage Weight Gain (%WG)
The Percentage Weight Gain (%WG) was determined as:
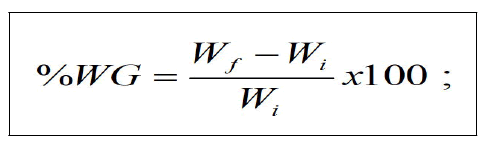
Where Wf=final weight of fish, Wi=initial weight of fish.
Specific Growth Rate (SGR)
Specific Growth Rate (SGR) was calculated as;
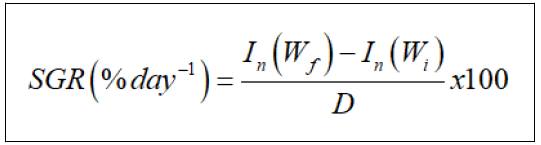
where In(Wf) is the natural logarithm of final fish body average weight, In(Wi) is the natural logarithm of initial fish body average weight and D is the duration of the experiment (days).
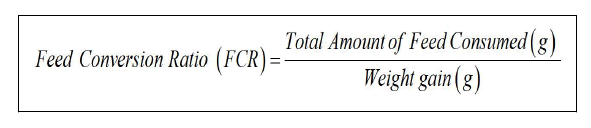
Feed Conversion Ratio (FCR)
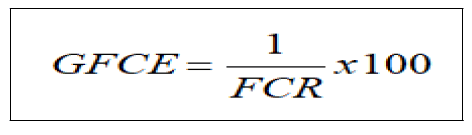
Gross Food Conversion Efficiency (GFCE)
The Gross Food Conversion Efficiency was calculated according to Stickney, as a percentage of the reciprocal of feed conversion ratio.
Protein Intake (PI)
The Protein Intake was calculated according to Garling and Wilson formula:
Protein Intake (g)=Feed intake (g) x %Protein in the diet.
Protein Efficiency Ratio (PER)
Percentage survivability
Statistical analysis
Experimental data were presented inform of mean ± SD, with alpha level (p<0.05) Analysis of Variance (ANOVA). Levels of significance were determined at 5% confidence limit using Least Significant Difference (LSD) and the DNMR test [38].
Results
Table 1 below shows the percentage composition of each feed ingredients used in the diets formulation. The diets varied with increase in the percentage inclusion of BSF i.e. Diet1 (0% BSF and 100% FM), Diet2 (20% BSF and 80% FM), Diet3 (40% BSF 60% FM), Diet4 (60% BSF and 40% FM), Diet5 (80% BSF and 20% FM) and Diet6 (100% BSF and 0% FM) respectively. On the other hand, soybean meal, maize, oil, vitamin, CaCO3 and premix had constant percentage diets’ inclusions.
| Ingredient | Diets composition | |||||
|---|---|---|---|---|---|---|
| Diet1 | Diet2 | Diet3 | Diet4 | Diet5 | Diet6 | |
| Fishmeal | 51.5 | 41.2 | 30.9 | 30.9 | 10.3 | 0 |
| BSFM | 0 | 10.3 | 20.6 | 20.6 | 41.2 | 51.5 |
| SBM | 25.2 | 25.2 | 25.2 | 25.2 | 25.2 | 25.2 |
| Maize | 15.8 | 15.8 | 15.8 | 15.8 | 15.8 | 15.8 |
| Vitamin C | 1 | 1 | 1 | 1 | 1 | 1 |
| Oil | 5 | 5 | 5 | 5 | 5 | 5 |
| CaCO3 | 0.5 | 0.5 | 0.5 | 0.5 | 0.5 | 0.5 |
| Premix | 1 | 1 | 1 | 1 | 1 | 1 |
| Note: Values in the same row with the same superscript are not significantly different. (p>0.05). | ||||||
Table 1: Diets composition (g).
The cumulative growth data is presented in Table 2. The average body weight range between 5.47 ± 1.28 and 6.45 ± 0.26 g (Table 2 and Figure 2) between groups of C. gariepinus at the beginning of the experiment and were not significantly different (P>0.05), indicating that groups were randomly divided and homogenous.

Figure 2: Shows mean values of the weight change across the diets throughout the experiment.
Note: The initial weights ranged from 5.47 ± 1.28 to 6.45 ± 0.26. And the final weights ranged from 9.78 ± 0.46 to 12.73 ± 2.97. The highest initial and final mean weight was recorded in Diet3. Meanwhile, the lowest initial and final weights were recorded in Diet6 and Diet1, respectively. However, there was statistically no significant difference in both initial and final weights across the diets.
| Diet1 | Diet2 | Diet3 | Diet4 | Diet5 | Diet6 | |
|---|---|---|---|---|---|---|
| Initial weight (g) | 5.83 ± 0.52a | 6.38 ± 0.30a | 6.45 ± 0.26a | 5.97 ± 0.93a | 5.60 ± 1.44a | 5.47 ± 1.28a |
| Final weight (g) | 9.78 ± 0.46a | 11.46 ± 1.82a | 12.73 ± 2.97a | 11.11 ± 4.00a | 11.27 ± 3.41a | 10.87 ± 4.67a |
| Weight gain (g) | 1.98 ± 1.68a | 2.76 ± 0.39a | 3.62 ± 2.71b | 2.32 ± 2.13a | 3.01 ± 2.17b | 2.92 ± 2.12a |
| % Weight gain | 34.55 ± 29.34a | 43.35 ± 34.56a | 56.70 ± 42.31b | 38.49 ± 35.02a | 53.92 ± 38.70b | 51.36 ± 37.26b |
| SGR | 0.37 ± 0.60a | 0.51 ± 0.57a | 0.72 ± 0.49b | 0.42 ± 0.52a | 0.71 ± 0.46b | 0.64 ± 0.57b |
| FCR | 5.72 ± 2.89a | 2.45 ± 1.98a | 1.09 ± 0.60b | 4.48 ± 0.02a | 1.92 ± 0.38b | 2.34 ± 0.21a |
| GFCR | 129.84 ± 112.87a | 187.21 ± 156.96b | 266.56 ± 214.18c | 158.72 ± 152.32b | 213.53 ± 166.28c | 210.04 ± 167.40c |
| PI | 21.40 ± 21.29a | 21.59 ± 21.03a | 21.79 ± 20.58a | 21.38 ± 21.04a | 21.76 ± 20.65a | 21.74 ± 20.92a |
| PER | 0.19 ± 0.18a | 0.26 ± 0.23b | 0.32 ± 0.28c | 0.23 ± 0.23b | 0.27 ± 0.24b | 0.26 ± 0.23b |
| % Survivability | 92.91 ± 6.38a | 88.42 ± 15.2a | 92.25 ± 6.39a | 87.95 ± 14.92a | 91.71 ± 7.39a | 90.86 ± 6.16a |
Table 2: Mean cumulative growth rate and nutrient utilization parameters.
After 12 weeks of commencement of the experiment, the average body weight gain shows significant difference (P<0.05), affected by the increasing dietary levels. The weight gain of fish fed different protein level fell into two groups. The group of fish fed on diet 1, 2, 4 and 6 which contain (0% BSF and 100% FM), (20% BSF and 80% FM), (60% BSF and 40% FM) and (100% BSF and 0% FM) respectively had a significantly (P<0.05) lower body weight than the other treatments. Groups of fish fed on diets 3 and 5 which contain (40% BSF, 60% FM) and (80% BSF and 20% FM) had higher significant values.
After the experimental period, diets 3 and 5 resulted in a significantly (P<0.05) higher body weight (Table 2 and Figure 3) than the other treatments followed by diets 6 and 2.

Figure 3: Shows the mean weight gain of fish in each diets throughout the 12 weeks experiment.
Note: In the first week, there was weight loss in all treatments; this is assumed to be as a result of the unfamiliarization of the fish to the new diets. However, the highest weight gain was recorded in Diet3 (3.62 ± 2.71), which had 40% BSF inclusions, followed by Diet5 (3.01 ± 2.17), which had 80% BSF inclusion. While the lowest weight gain was recorded in Diet1 (1.98 ± 1.68), with 0% BSF inclusion.
The groups fed on diets 1 and 4 had a significantly (P<0.05) lower body weight. The data of weight as percent of the initial weight of fish are also presented in Table 2 and Figure 4.

Figure 4: Percentage weight gain.
Note: The percentage weight gain observed is shown in the above with varied diet composition. The values of the percentage weight gain observed in this study ranged from 56.70 ± 42.31-34.55 ± 29.34. Consequently, the highest percentage weight gain was recorded in Diet3, Diet5 and Diet6, 56.70 ± 42.31, 53.92 ± 38.70 and 34.55 ± 29.34 respectively.
The differences in the final body weight were reflected by difference in the Specific Growth Rate (SGR) which is presented in Table 2 and Figure 5.

Figure 5: The specific growth rates observed across the treatments.
Note: The mean values of specific growth rate recorded in all the diets ranged from 0.37 ± 0.60, 0.72 ± 0.49. Diet3 and Diet5 were observed to have the highest specific growth rates, 0.72 ± 0.49 and 0.71 ± 0.46 respectively. On the other hand, Diet1 had the lowest specific growth rate, 0.37 ± 0.60.
At the end of the experiment, the specific growth rate was significantly different (P<0.05) in diets (1, 2 and 4) and diets (3, 5 and 6). The differences in the final body weight were reflected by difference in the specific growth rate.
The group of fish fed on diet3 had a significant (P<0.05) better FCR (Table 2 and Figure 6) with value of 1:1 (1.09 ± 0.60) followed by diet5 with FCR of 1.92 ± 0.38 respectively.

Figure 6: Feed conversion ratio across the treatments.
Note: Figure 6 expressed feed conversion ratio across the treatments. Diet1 was observed to have the highest feed conversion ratio, 5.72 ± 2.89. Diet3, in which the highest weight gain was recorded, had the lowest FCR, 1.09 ± 0.60, which can considered the best FCR value in this study. However, there was no statistical difference between Diet3 and Diet6.
The group of fish fed diets 1, 2, 4 and 6 however had the lowest level of feed efficiency with FCR values of 5.72 ± 2.89, 2.45 ± 1.98, 4.48 ± 0.02 and 2.34 ± 0.21 respectively.
Table 2 and Figure 7 shows GFCR with significant difference (P<0.05) observed between diets (1), (2 and 4) and (3 and 5) respectively.

Figure 7: Gross feed conversion ratio in the treatments.
Note: Diet3 had the highest gross feed conversion ratio, followed by Diet5, 266.56 ± 214.18 and 213.53 ± 166.28, respectively. Again, Diet1 had the least GFCR, 129.84 ± 112.87.
No significant difference (P>0.05) was observed between fish fed diets (2 and 4) as well as diets (3 and 5) respectively when the means were compared.
The highest mean protein intake (Table 2, Figure 8) was observed in fish fed diet3, though no significant difference was observed across the six diets.

Figure 8: Shows the protein intake across the treatments.
Protein efficiency ratio was calculated for each group and is presented in Table 2 and Figure 9.

Figure 9: The protein efficiency ratio across the diets.
The PER values were 0.19 ± 0.18, 0.26 ± 0.23, 0.32 ± 0.28, 0.23 ± 0.23, 0.27 ± 0.24 and 0.26 ± 0.23 respectively. No significant difference (P>0.05) was observed in fish fed diets 2, 3, 4 and 6. Statistical analysis revealed that fish fed diet1 (0.19 ± 0.18) had a significantly (P<0.05) lower PER value while diet3 (0.32 ± 0.28) had a higher PER values than groups 2, 3, 4 and 6 respectively.
The percentage survivability across the treatments are expressed in Table 2 and Figure 10.

Figure 10:The percentage survivability across the treatments.
However, Diet1 (92.91 ± 6.38), with the least weight gain, appeared to have the highest percentage survivability, followed by Diet3 (92.25 ± 6.39), respectively. Though, there was no significant difference in percentage survivability across the diets, except for diet4, in which the lowest (87.95 ± 14.92) percentage survivability was recorded.
Discussion
The global production of fed fish tripled between 2000 and 2017 [39] while the annual catch of forage fish used to make fishmeal and fish oil decreased from 23 Mt 16 Mt [40]. In fish culture, feeding constitutes more than 50% of the operating costs, with protein being the most expensive dietary source. The majority of aqua-feed formulations are based mainly on fishmeal as the dietary protein source. The availability of fishmeal in the future to sustain the rapid expansion of aquaculture and aqua-feed production is questionable [41,42]. The formulations differences between FM and BSFL affected the level of BSFL, which may be incorporated into the diet. With over 40% share of BSFL, the potential environmental sustainability of the diet, as well as the extrusion process and feed properties may be influenced impaired. Different inclusion levels of BSFL have shown promising results in a variety of aquaculture species; where up to 100 % replacement for fishmeal is possible without serious adverse effects [33]. However, in many cases, when levels of inclusion are above 50%, negative effects on growth parameters could be seen. Priyadarshana, et al., [43] reported that this is probably due to high chitin content, high crude fat content and inability of fish species and growth stage to utilise insect-based diets. The body composition of BSFL fed fish, in many cases, seem to be positively affected. Nutritional analysis on the use of BSFL for C. gariepinus is a novelty. There was a study describing the application of insect species in the diet of this aquatic faunas species [44,45]. The feed acceptability suggests that insectderived materials may be strong attractants for aquatic animals [46]. The gross composition of the experimental diets indicated that Diet1 had no BSFL inclusion and fishmeal was completely replaced with BSF in Diet6, while Diet2, Diet3, Diet4 and Diet5 had 20%, 40%, 60% and 80% BSFL inclusions. Fish fed Diet3, which had 40% BSFL inclusion, had higher weight gain than other levels of inclusion, while Diet1 with 0% inclusion, had the lowest weight gain. However, this result was different from the report of Talamuk, et al., [47], who reported highest and lowest weight gain at 10% and 30%, respectively. This may be due to the mode of percentage inclusion or culture system. On the other hand, the result was similar to that of the study of Muin, et al., and Rana, et al., [48,49] who incorporated 25%, 50%, 75% and 100% BSFL meal in Oreochromis niloticus fingerlings diets. Highest values of WG and PER were reported at 50% inclusion rate. Fish fed with 50% BSFL meal showed the highest SGR and best FCR values. Figure 4 indicated the percentage weight gain of fish fed Diet3, Diet5, and Diet6, were significantly different from other treatments. The lowest percentage weight gain was observed in Diet1. Meanwhile, statistically, there was no significant difference between the specific growth rate of Diet3, Diet5, and Diet6, as they were observed to have the highest specific growth rate, 0.72 ± 0.49, 0.71 ± 0.46, and 0.64 ± 0.57, respectively. Similar result was observed in FCR and GFCR. Diet3 and Diet5 had the best FCR while the highest value of FCR was observed in Diet1. Similarly, the same study carried out by Muin, et al., (2017) on incorporation of BSF in the diet of Oreochromis niloticus, ideal value of FCR was observed in Diet3, which had 50% BSF inclusion. Consequently, Diet3 also had the highest gross feed conversion ratio.
The protein and amino profile of black soldier fly is similar to that of fish meal [50]. This study revealed that feed intake was remarkably reduced at the beginning and gradually increased with time. Statistically, there was no significant difference in protein intake across the treatments. However, Diet3 had the highest protein intake value, 21.79 ± 20.58. Conversely, the protein efficiency ratio varied across treatments. And the PER in Diet3 was observed to be significantly different from other treatments. Percentage survivability, as expressed in Figure 10, appeared to be highest in Diet1 (92.91 ± 6.38) with 0% BSF inclusion, whereas Diet4, with 60% BSF inclusion, had the least percentage survivability, 87.95 ± 14.92. In the present research, there were no significant differences among treatments in terms of feed intake, which reveals that all of the experimental feeds could be provided to fish as whole daily rations without consumption delay or unacceptability. However, all other growth performance and feed utilization parameters, including BW, BWG, SGR, PWG, FCR and PER an improvement was observed as a consequence of increasing BSFL incorporation into the diets. All the aforementioned findings are in agreement with the results of Mateusz, et al., [51].
Conclusion
This study revealed that growth and nutrient utilization varies with levels of black soldier fly can be utilized as a potential alternative to fishmeal in the diets of African catfish, C. gariepinus. Fishmeal can be completely replaced with black soldier fly in the diet of African catfish, without adverse effect on growth. About 40% replacement of fishmeal with black soldier fly is the recommendable level of incorporation of black soldier fly in the diet of African catfish.
Authorship Contribution Statement
Ayofe M Hammed and Albert O Amosu: Conceptualization, methodology, software, validation, writing–original draft. Lucas O Dalmeida and Theophilus F Sunnuvu: Formal analysis, investigation, writing–review and editing, project administration. Olufemi O Joseph and Oluwajuwon A Fasasi: Methodology, resources, supervision, review and editing.
Declaration of Competing Interest
The authors declare that they have no known competing financial interests or conflict of interest.
Acknowledgement
We want to show appreciation to the following: Department of fisheries, faculty of science, Lagos State University; Department of Agricultural Science, fisheries unit of the Department of Agricultural Science, Lagos State University of Education and Sej. Farm Ventures in Badagry area of Lagos, Nigeria.
References
- Food and Agricultural Organization (FAO) (2000) the state of world fisheries and aquaculture 2000.
- FAO (2018) The State of World Fisheries and Aquaculture 2018
- FAO (2020) The State of World Fisheries and Aquaculture 2020.
- Tan Q, Xie S, Xhu X, Lei W, Yang Y (2007) Effect of carbohydrate to lipid ratios on growth and feed efficiency in Chinese long snout catfish (Leiocas islongirostris). J Appl Ichthyol 23: 605-610.
[Crossref], [Google Scholar]
- Onyia LU, Michael KG, Ekoto B (2013) Haematological profile, blood group and genotype of Heterobranchus bidorsalis. Net J Agric Sci 1: 69-72.
- Ashraf M, Zafar A, Rauf A, Mehboob S, Qureshi NA (2011) Nutritional values of wild and cultivated silver carp (Hypophthalmichthys molitrix) and grass carp (Ctenopharyngodon idella). Int J Agric Biol 13: 210-214.
- Sugunan VV (2002) Enhancement: An effective tool for increasing in land fish production. Fishing Chimes 21: 21-22.
- FAO (2016) The state of world fisheries and aquaculture 2016.
- Cook JT, Frank DA (2008) Food security, poverty, and human development in the United States. Ann N Y Acad Sci 1136: 193-209.
[Crossref], [Google Scholar], [Indexed]
- Delgado CL, Wada N, Rosegrant MW, Meijer S, Ahmed M (2003) Fish to 2020: Supply and demand in changing global markets.
- Food and Agriculture Organization (FAO) (2012) The state of world fisheries and aquaculture 2012.
- Food and Agriculture Organization (FAO) (2014) The state of world fisheries and aquaculture 2014.
- OECD (2016) OECD-FAO agricultural outlook.
- Food and Agricultural Organization (FAO) (2017) FAO Aquaculture Newsletter.
- Aquaculture and Inland Fisheries Project (AIFP) (2004) Inventory of fish farms, lakes and feed producers in Nigeria.
- Hasan MR (2001) Nutrition and feeding for sustainable aquaculture development in the third millennium. Technical proceedings of the conference on aquaculture in the third millennium Thailand.
- Heindl U (2002) Phytase: How does the enzyme work in fish nutrition. Asian Aquaculture Magazine 2: 19-24.
- Fagbenro OA, Adeparusi E, Fapohunda OO (2003) Feedstuff and dietary substitution for farmed fish in Nigeria.
- Abalaka SE (2013) Evaluation of the haematology and biochemistry of Clariasgariepinusas biomakers of environmental pollution in Tiga dam, Nigeria. Braz Arch Biol Technol 56: 371-376.
[Crossref], [Google Scholar]
- Olaifa FE, Olaifa AK, Lewis OO (2003) Toxic stress of lead on Clarias gariepinus (African catfish) fingerlings. Afr J Biomed Res 6.
[Crossref], [Google Scholar]
- Ogundiran MA, Fawole OO, Adewoye SO, Ay TA (2009) Pathologic lesions in the gills of Clarias gariepinus exposed to sublethal concentrations of soap and detergent effluents. J cell anim biol 3: 78-82.
- Herdson D, Priede I (2011) Oreochromis mossambicus.”IUCN Red List of Threatened Species.
- Albert OA, Ayofe MH, Lucas OD, Olufemi OJ, Theophilus FS, et al. (2023) Compositional analytical of nutritional Characterization, chemical and microbial composition of some fish species. Ind J Agri Life Sci 3: 7-14.
- Fredrik SL, Devlin RH, Johnsson JI, Biagi CA (2003) Vertical position reflects increased feeding motivation in growth hormone transgenic coho salmon (Oncorhynchus kisutch). Ethology 109: 701-712.
[Crossref], [Google Scholar]
- Martins CI, Schrama JW, Verreth JA (2005) The consistency of individual differences in growth, feed efficiency and feeding behaviour in African catfish Clariasgariepinus (Burchell 1822) housed individually. Aquac Res 36: 1509-1516.
[Crossref], [Google Scholar]
- Mohanty B, Mahanty A, Ganguly S, Sankar TV, Chakraborty K, et al. (2014) Amino acid compositionsof27food fishes and their importance in clinical nutrition. J Amino Acids
[Crossref], [Google Scholar], [Indexed]
- Suvitha S, Eswar A, Anbarasu R, Ramamoorthy K, Sankar G (2015) Proximate, amino acid and fatty acid profile of selected two marine fish from parangipettai coast. Asian J Biomed Pharm Sci 04: 38-42.
- Sogbesan AO, Ugwumba AAA (2008) Nutritional evaluation of termite (macrotermes subhyalinus) mealas animal protein supplements in the diets of heterobranchus longifilis (valenciennes, 1840) fingerlings. Turkish J Fish Aquat Sci 8: 149-157.
- Wang J, Jiang Y, Li X, Han T, Yang Y, et al. (2016) Dietary protein requirement of juvenile red spotted grouper (epinephelus akaara). Aquaculture 450: 289-294.
[Crossref], [Google Scholar]
- Sales J, Janssens PJG (2003) Nutrient requirements of ornamental fish. Aquatic Living Resour 16: 533-540.
[Crossref], [Google Scholar]
- Oosting S, van der Lee J, Verdegem M, de Vries M, Vernooij A, et al. (2021) Farmed animal production in tropical circular food systems. Food Sec 14: 273-292.
[Crossref], [Google Scholar]
- Steven C, Helfrich LA (2002) Understanding fish nutrition, feeds, feeding. Virginia Cooperative Extension 63: 256-270.
- Wang G, Peng K, Hu J, Yi C, Chen X, et al. (2019) Evaluation of defatted black soldier fly (hermetia illucens l) larvae meal as an alternative protein ingredient for juvenile Japanese seabass (lateolabrax japonicus) diets. Aquaculture 507: 144-154.
[Crossref], [Google Scholar]
- Schuchardt D, Vergara JM, Palaciso HF, Kalinowski CT, Cruz CMH, et al. (2008) Effects of different dietary protein and lipid levels on growth, feed utilization and body composition of redporgy (Pagrus pagrus) fingerlings. Aquaculture Nutrition 14: 1-9.
[Crossref], [Google Scholar]
- Fashina-Bombata HA, Hammed AM (2010) Determination of nutrient
requirements of an ecotype cichlid of epe lagoon, southwest
Nigeria. Glob J Agric Sci 9: 57-61. - Hammed AM, Amosu AO, Fashina-Bombata HA (2013) Effect of partial and total replacement of soybean meal with pigeon pea (Cajanus cajan) as alternative plant protein source in the diet of juveniles African mud catfish (Clarias gariepinus (Burchell, 1822). Int J Food Sci Technol Photon105: 139-145.
- Hammed AM, Amosu AO, Fashina-Bombata HA, Ajepe RG, Olufowobi MT (2014) The use of coconut (Cocos nucifera) oil as an alternative source of energy in the diets of African Mudcat-fish (Clarias gariepinus-Burchell, 1822) Juveniles. Int J Eng Res 5: 431-436.
- Duncan DB (1955) Multiple range and multiple F test. Biometric 11: 1-42.
[Crossref], [Google Scholar]
- Tacon AG (2020) Trends in global aquaculture and aquafeed production: 2000-2017. Rev Fish Sci Aquac 28: 43-56.
[Crossref], [Google Scholar]
- Pauly D, Zeller D, Palomares MD (2020) Sea around US concepts, design and data (2020).
- Gatlin DM, Barrows F, Brown P, Dabrowski K, Gaylord TG, et al. (2007) Expanding the utilization of sustainable plant products in aquafeeds: A review. Aquac Res 38: 551-579.
[Crossref], [Google Scholar]
- Suarez JA, Tudela C, Davis D, Daugherty Z, Taynor M, et al. (2013) Replacement of fish meal by a novel non-GM variety of soybean meal in cobia, rachycentron canadum: Ingredient nutrient digestibility and growth performance. Aquaculture 416: 328-333.
[Crossref], [Google Scholar]
- Priyadarshana MKC, Walpita CN, Naveenan M, Magamage MPS, Arachchige H, et al. (2021) Substitution of fishmeal with black soldier fly Hermetiaillucens linnaeus, 1758 larvae in finfish aquaculture-A review. Asian Fisheries Science, 34, 114.
- Jozefiak A, Nogales-Merida S, Rawski M, Kiero-nczyk B, Mazurkiewicz J (2019) Effects of insect diets on the gastrointestinal tract health and growth performance of Siberian sturgeon (Acipenser baerii Brandt, 1869). BMC Vet Res 15: 348.
[Crossref], [Google Scholar], [Indexed]
- Caimi C, Renna M, Lussiana C, Bonaldo A, Gariglio M, et al. (2020) First insights on black soldier fly (Hermetia illucens L.) larvae meal dietary administration in Siberian sturgeon (Acipenser baerii Brandt) juveniles. Aquaculture 515: 734539.
[Crossref], [Google Scholar]
- Murofushi S, Ina K (1981) Survey of feeding stimulants for the sea bream present in the dried pupae of silkworms. Agric Biol Chem 45: 1501-1504.
[Crossref], [Google Scholar]
- Talamuk R (2016) Comparisons of growth performance of African catfish (Clarias gariepinus Burchell, 1822) fingerlings fed different inclusion levels of black soldier fly (Hermetia illucens) larvae meal diets. Thesis.
- Muin H, Taufek NM, Kamarudin MS, Razak SA (2017) Growth performance, feed utilisation and body composition of Nile tilapia, Oreochromis niloticus (Linnaeus, 1758) fed with different levels of black soldier fly, Hermetia illucens (Linnaeus, 1758) maggot meal diet. Iran J Fish Sci 16: 567-577.
[Crossref], [Google Scholar]
- Rana KMS, Salam MA, Hashem S, Islam MA (2015) Development of black soldier fly larvae production technique as an alternate fish feed. Int J Res Fish Aquac 5: 41-47.
- Elwert C, Knips I, Katz P (2010) A novel protein source: maggot meal of the black soldier fly (Hermetia illucens) in broiler feed. TagungSchweine-und Geflügelernährung 11: 140-142.
- Mateusz R, Jan M, Bartosz KN, Damian J (2020) Black soldier fly full-fat larvae meal as an alternative to fish meal and fish oil in Siberian sturgeon nutrition: The Effects on physical properties of the feed, animal growth performance, and feed acceptance and utilization. Animals 10: 2119.
[Crossref], [Google Scholar], [Indexed]

Open Access Journals
- Aquaculture & Veterinary Science
- Chemistry & Chemical Sciences
- Clinical Sciences
- Engineering
- General Science
- Genetics & Molecular Biology
- Health Care & Nursing
- Immunology & Microbiology
- Materials Science
- Mathematics & Physics
- Medical Sciences
- Neurology & Psychiatry
- Oncology & Cancer Science
- Pharmaceutical Sciences