Growth Performance, Nutrient Utilization, Somatic Indices and Cost Benefit Analyses of African Basil Leaf Additive Diets on Clarias gariepinus (Burchell, 1822) Fingerlings
Sogbesan OA, Ahmed YM, Ajijola KO
DOI10.21767/2572-5459.100030
Sogbesan OA*, Ahmed YM and Ajijola KO
Department of Fisheries, Modibbo Adama University of Technology, Yola, Adamawa State, Nigeria
- Corresponding Author:
- Sogbesan OA
Department of Fisheries
Modibbo Adama University of Technology
Yola, Adamawa State, Nigeria
Tel: +2348161518298
E-mail: sokayfish@gmail.com
Received Date: June 02, 2017; Accepted Date: June 27, 2017; Published Date: June 30, 2017
Citation: Sogbesan OA, Ahmed YM, Ajijola KO (2017) Growth Performance, Nutrient Utilization, Somatic Indices and Cost Benefit Analyses of African Basil Leaf Additive Diets on Clarias gariepinus (Burchell, 1822) Fingerlings. J Anim Res Nutr Vol No 2 Iss No 1:10 doi:10.21767/2572-5459.100030
Copyright: © 2017 Sogbesan OA. This is an open-access article distributed under the terms of the Creative Commons Attribution License, which permits unrestricted use, distribution, and reproduction in any medium, provided the original author and source are credited.
Abstract
Twelve weeks feeding experiment was carried out to evaluate the effect of Ocimum gratissimum as additive in the diet of Clarias gariepinus. 40% isoproteic diet was formulated and fermented O. gratissimum was included at 0%, 1%, 2%, 3% and 4%. The diets were coded T1, T2, T3, T4 and T5 150 fingerlings of mean weight 3.54 ± 0.12 g and length 5.95 ± 0.12 cm were stocked in 15 circular tanks of diameter 0.55 m at the rate of 10 fingerlings per tank in wet laboratory of the Fisheries department. They were fed 5% bodyweight for 12 weeks. Highest mean weight gain of 26.21 was recorded in T1 and lowest of 22.60 g from T2 while specific growth rate ranged between 1.03–1.12%/day. Highest Feed intake of 26.50 g was recorded in T1 and lowest of 18.92 g in T5, feed conversion ratio of 1.01 was recorded highest in T1 and lowest (0.83) in T5 which are not significantly different (p>0.05) and protein intake of 10.73 was recorded highest in T1 and lowest of 7.73 in T5. Highest hepatosomatic of 1.66 was recorded in T5 and lowest of 0.76 in T2 and viscerosomatic was recorded highest in T4 with value of 12.12 and lowest of 7.03 in T1. The highest cost of feed with value of ₦39.50 was recorded in T1and T5 had the lowest value of 38.90, cost of feeding was recorded highest in T1 with value of ₦10.47 and lowest value was recorded in T5 with value of ₦7.53. the net profit of ₦45.53 was recorded as highest value in T1 and ₦41.90 which is lowest was recorded in T2, the profit index of ₦1.92 was recorded highest in T1 and ₦1.78 was recorded in T2 as the lowest value and lastly benefit cost ratio of ₦ 2.56 recorded highest in T5 and ₦2.47 which is lowest value was recorded in T2. T4 is therefore recommended for the health status, growth and cost benefit.
Keywords
Growth; Feed utilization; Cost benefits; Basil leaf; Additive; Clarias gariepinus
Introduction
Aquaculture, the cultivation of fresh and saltwater fish, shellfish, and algae, is being increasingly recognized as an important method of food production and accounts for close to half of the fish consumed worldwide (FAO, 2010) [1]. For those who are raising fish, it is critical from a number of perspectives to consider the ingredients composition of the feed. For maximal growth, fish nutrition needs to be tailored towards species, sex, stages of development and nutrient requirements. Given that fish feed is one of the highest operating costs of an aquaculture system projected to be within 60-70% calls for its maximization through improve feed conversion ratio and reduction of costly feed ingredients judiciously (Sogbesan and Ekundayo, 2015) [2] Ultimately, the goal should be to optimize the nutritional composition of fish for consumption, since fish represent the main source of long-chain omega-3 fatty acids (LC ω-3 FA) in the human diet.
In general, gross malnutrition is no longer a problem, however, we are now faced with the more challenging task of determining the more subtle effects that micronutrients, and their interactions with other dietary components have on the immune system of fish. Several reviews have dealt with the subject of nutrition and their response in fish however, we lack complete information on the quantitative nutrient requirements of most fish [3-5].
O. gratissimum is an herbaceous plant which belongs to the Labiatae family. The plant is indigenous to tropical areas especially India and it is also in West Africa. In Nigeria, it is found in the Savannah and coastal areas. It is cultivated in Ceylon, South Sea Islands, and also within Nepal, Bengal, Chittagong and Deccan [6]. In the southern part of Nigeria, the plant is called “effinrin-nla” by the Yoruba speaking tribe. It is called “Ahuji” by the Igbos, while in the Northern part of Nigeria the Hausas call it “Daidoya” [7].
Feed additives are not nutrients but are edible materials added to feed for the purpose of performing specific functions which are capable of improving the texture, strength of pellets, taste, aroma, attraction, feed consumption, utilization, prevent stress from infection and disease, cure disease and promote growth and reproduction. They could be in form of drugs (antibiotics), anti-oxidant, flavors or attractants, vitamins, amino acids (synthetic), binders, preservatives, hormones and carotenoid supplements. Antioxidants are used in feeds to prevent quality deterioration through the prevention of rancid oxidation of fats and nutrient deficiency [8]. Attempts to use the natural materials such as medicinal plants could be widely accepted as feed additives to enhance efficiency of feed utilization and aquaculture productive performance. In the last decade, some studies show the positive effects of dietary medicinal plants and feed additives on growth and feed utilization in fish [9-13].
Materials and Methods
A Completely randomize design (CRD) in which the additive was added at an equal interval to each of the diet was used. 600.0g of Fresh Africa basil leaves were purchased from Sabo Geri market washed and divided into three equal parts. This first part was packed into a transparent polythene bag, air-tighten and kept in a refrigerator for 5 days. This is to keep the freshness of the leaves. The second part was fermented by keeping it moist, kept in a white plastic bowl with cover and put in the laboratory cupboard for a darkened environment needed for a solid state fermentation according to Sogbesan. The fermentation lasted for five (5) days, and then the leaves were removed. The third portion was air-dried under laboratory condition for five days. At the end of the fifth day, all the products were separately grinded and used for phytochemical and proximate analysis [2].
Five different groups of feed was formulated at the same 40% crude protein in which group T1 was a control feed, groups T2, T3, T4 and T5 contained 1 g, 2 g, 3 g and 4 g respectively. Other ingredients were soybean meal, fish meal, maize meal, vitamin premix, lysine, methionine, salt, palm oil, starch as presented on Table 1. One hundred and seventy healthy fishes were collected from Emmanuel fish farm and were conditioned to experimental diets for seven days before the commencement of full experiment. The experiment was set-up in wet laboratory of fisheries department, 15 bowls were used for the experiment and each treatment diet were triplicated in which each treatment has different colour of bowl and labeled to avoid mixed up and confusion. Fishes were stocked 10 per bowl and each were aerated for complete 4 weeks and covered with mosquito net. Each treatment were triplicated in three places in which they were ten fish per each replicate. The fingerlings were fed 5% of their body weight with experimental diet for the period of twelve weeks and were fed twice daily at 9 am in the morning and 4 pm in the evening.
| Ingredients composition | Experimental Diets | ||||
|---|---|---|---|---|---|
| T1 | T2 | T3 | T4 | T5 | |
| Maize | 30 | 29 | 28 | 27 | 26 |
| Fish meal | 33 | 33 | 33 | 33 | 33 |
| Soybean | 32 | 32 | 32 | 32 | 32 |
| FOGLM | 0 | 1 | 2 | 3 | 4 |
| Palm oil | 1 | 1 | 1 | 1 | 1 |
| Bone meal | 0.5 | 0.5 | 0.5 | 0.5 | 0.5 |
| Vitamin premix | 0.5 | 0.5 | 0.5 | 0.5 | 0.5 |
| Iondized salt | 0.5 | 0.5 | 0.5 | 0.5 | 0.5 |
| Cassava starch | 0.5 | 0.5 | 0.5 | 0.5 | 0.5 |
| Lysine | 1,00 | 1 | 1 | 1 | 1 |
| Methionine | 1 | 1 | 1 | 1 | 1 |
| Total | 100 g | 100 g | 100 g | 100 g | 100 g |
| Calculated protein | 40.5 | 40.58 | 40.68 | 40.8 | 40.9 |
| Feed cost | 39.5 | 39.4 | 39.2 | 39.1 | 38.9 |
| Calculated Gross energy kcal/J | 410.4 | 409.4 | 408.35 | 407.29 | 406.24 |
| Calculated Digestible energy kcal/J | 365.93 | 365.29 | 364.64 | 364.01 | 363.36 |
| Gross energy :protein | 10.13 | 10.08 | 10.04 | 10 | 9.93 |
| Digestible energy: protein | 9.03 | 9.01 | 8.96 | 8.93 | 8.88 |
Table 1: Percentage composition of Dry matter (g/100 g) of Experimental Diet.
The survival rate of fish was monitored during the feeding period from the beginning of the experiment to the end of experiment. According to Fasakin et al., as follows:
Bioindices
Mean Weight gain (g): This was determined by taking the initial.
Mean Weight Gain = Wf - Wi
Relative Growth Rate (RGR):
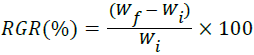
Specific Growth Rate (SGR):
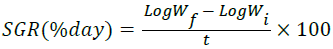
Condition factor (k):

Protein Efficiency Ratio (PER):

Statistics analysis: Data collected were subjected to descriptive statistics, graph line representation and One-way ANOVA.
Results
The biweekly weight gain recorded for each experimental diets increases as experimental period increase as showed in Figure 1. The mean weight gain of C. gariepinus fingerlings fed diets contained O. gratissimum for the period of 12-weeks as presented in Table 2.

Figure 1: Weekly growth of Clarias gariepinus fed Ocinum gratissimum additive diets.
| Growth performance parameters | T1 (0%) | T2 (1%) | T3 (2%) | T4 (3%) | T5 (4%) |
|---|---|---|---|---|---|
| Mean initial length (cm) | 5.95a | 5.87a | 6.10a | 6.33a | 5.77a |
| Mean final length (cm) | 14.30a | 13.33a | 13.35a | 13.42a | 13.45a |
| Mean initial weight (g) | 3.39 | 3.5 | 3.57 | 3.72 | 3.5 |
| Mean final weight (g) | 29.6 | 26.1 | 26.18 | 27.38 | 26.3 |
| Mean weight gain (g) | 26.21c | 22.60a | 22.61a | 23.66b | 22.80b |
| Relative growth rate (%) | 773.15 | 645.71 | 633.33 | 636.02 | 651.42 |
| Specific growth rate (%/day) | 1.12b | `1.04a | 1.03a | 1.03a | 1.04a |
| Condition factor (K1) | 1.61 | 1.73 | 1.57 | 1.47 | 1.82 |
| Condition factor (K2) | 1.01b | 1.10a | 1.10a | 1.13b | 1.08ab |
| Survival Rate | 95c | 95c | 80b | 90c | 70a |
Table 2: Growth performance, survival and condition factors of fish fed Ocimum gratissimum.
In terms of nutrient utilization highest feed intake was recorded in T1 with value of 26.50 g and lowest feed intake of 18.92 g was recorded in T5, The feed conversion ratio reduces with increased level of additive in the diets in which T1 has the highest value of 1.01 and T5 has the lowest value of 0.83, the protein intake reduced with increased level of additive in which T1 has the highest value of 10.73 and the T5 has the lowest value of 7.73, the protein efficiency ratio also followed the same trend with protein intake in which T1 has highest value of 0.65 and lowest value was recorded in T3 with value of 0.55.
The Somatic indices of this research comprise of hepatosomatic index and viscero somatic index has showed in Table 3.
| Feed Utilization Parameters | T1 (0%) | T2(1%) | T3 (2%) | T4 (3%) | T5 (4%) |
|---|---|---|---|---|---|
| Feed Intake (g) | 26.50a | 21.69b | 21.03bc | 21.53b | 18.92c |
| Feed Conversion Ratio | 1.01a | 0.96a | 0.93ab | 0.91ab | 0.83b |
| Protein Intake | 10.73a | 8.80b | 8.55b | 8.78b | 7.73c |
| Protein Efficiency Ratio | 0.65a | 0.56 a | 0.55 a | 0.60 a | 0.57 a |
| Hepatosomatic (%) | 1.40b | 0.76d | 1.14c | 1.22c | 1.66a |
| Viscerosomatic (%) | 7.03b | 7.60b | 10.42a | 12.12a | 9.10ab |
Table 3: Feed utilization and some somatic indices of Clarias gariepinus Fed Ocimum gratissimum additive diet.
The hepatosomatic index increases with increased level of additive in which T1 had the highest value of 1.40% and lowest value of 0.76% was recorded in T2 and viscerosomatic index value was highest in T4 with value of 12.12% and lowest value was recorded in T1 with value of 7.03%.
The cost benefit analysis of O. gratissimum as additive fed to O. gariepinus presented in Table 4. The following results were obtained which are cost of feed which has range between ÃÆâÃâââ¬Å¡Ãâæ38.90 to ÃÆâÃâââ¬Å¡Ãâæ39.50 in which T1 had the highest value of ÃÆâÃâââ¬Å¡Ãâæ39.50 and T5 had the lowest value of 38.90, cost of feeding was recorded highest in T1 with value of ÃÆâÃâââ¬Å¡Ãâæ10.47 and lowest value was recorded in T5 with value of ÃÆâÃâââ¬Å¡Ãâæ7.53. the net profit of ÃÆâÃâââ¬Å¡Ãâæ45.53 was recorded as highest value in T1 and ÃÆâÃâââ¬Å¡Ãâæ41.90 which is lowest was recorded in T2, the profit index of ÃÆâÃâââ¬Å¡Ãâæ1.92 was recorded highest in T1 and ÃÆâÃâââ¬Å¡Ãâæ1.78 was recorded in T2 as the lowest value and lastly benefit cost ratio of ÃÆâÃâââ¬Å¡Ãâæ 2.56 recorded highest in T5 and ÃÆâÃâââ¬Å¡Ãâæ2.47 which is lowest value was recorded in T2.
| Cost Benefit Parameters | T1 (0%) | T2 (1%) | T3 (2%) | T4 (3%) | T5 (4%) |
|---|---|---|---|---|---|
| Cost of feed | 39.5 | 39.4 | 39.2 | 39.1 | 38.9 |
| Mean cost of fingerlings stocked (ÃÆâÃâââ¬Å¡Ãâæ) | 20 | 20 | 20 | 20 | 20 |
| Cost of feeding | 10.47a | 8.55b | 8.25b | 8.42b | 7.53c |
| Estimate mean investment cost | 30.47a | 28.55b | 28.25b | 28.42b | 27.53c |
| Mean yield cost (ÃÆâÃâââ¬Å¡Ãâæ) | 76 | 70.45 | 70.5 | 71.6 | 70.69 |
| Net profit | 45.53a | 41.90c | 42.25bc | 43.18b | 43.17b |
| Profit index | 1.92 | 1.78 | 1.79 | 1.83 | 1.81 |
| Incidence of cost | 1.51 | 1.75 | 1.74 | 1.65 | 1.71 |
| Benefit cost ratio | 2.50b | 2.47c | 2.49c | 2.52b | 2.56a |
Table 4: Cost benefit analyses of experimental diets and fish.
Discussion
In this study, there was general increase in weight of fish fed all the experimental diets which is an indication that the fish were able to make use of the protein in feed by converting it into muscle. Although, fish fed diets with the additive recorded lowest weight gains compared to control diet. This might be an indication of an antigrowth factor though the weights were not significantly different (p>0.05) and this is agreed with report of Sogbesan et al. who reported lowest weight gain in the diets containing treated duckweed in comparison to the control [2]. The authors noted that this could be due to presence of antinutritional factors which can inhibit growth rate in fish. Dienye and Olumuji reported low growth and feed utilization by fish fed diets with increased levels of Moringa oleifera leaf meals [14]. Also, Richter et al. reported that low growth performance of fish could be caused by presence of anti-nutrients in Moringa oleifera such as tannins, phenol, phytate and saponins [15].
The specific growth rate from this study was recorded highest in control and lowest in the diets contained additive and this is in line with the report of Offor et al. in which the authors recorded highest specific growth rate in fish fed the control diet compared to those fed diets that contained 5%, 10% and 15% inclusion levels of dried basil leaf meal [16]. Similar observations have been reported by Erfanullah and Jafri for varying level of dietary carbohydrate, Alegbeleye et al. for Jackbean and Ochang et al. for palm oil. This reduction in mean weight gains and specific growth rate might due to anti-nutritional factors presence in the diet and this is supported by Oresegun and Alegbeleye that these anti- nutritional factors negate growth and other physiological activities at higher inclusion levels [17,18]
The best feed conversion ratio 0.83 recorded in diets contained 4% of additive which is evidence of an optimum utilization of fermented O. gratissimum, by C. gariepinus fingerlings and highest value of 1.01 FCR was recorded in the control diets. This implies that the additive enhances digestion of feed [19].
Feed conversion ratio of this study agreed with report of Marroh and Ekelemu who reported higher FCR in post fingerlings fed control diet than those fed on leaf meal at varied dietary levels. Adikwu started that the lower the FCR, the better the feed utilization by fish. According to Ilori et al. Junaid et al. and Ugwoke et al. leaf meals have been noted to support growth and nutrients utilization in Clarias gariepinus at limited quantities [20-23].
Condition factor is often use to determine health condition of fish, a high condition factor reflect good nutritional and environmental quality and low condition factor reflect poor nutritional and environmental quality (EPD) [24]. Ekelemu and Marroh documented that variation in condition factor might due to abundance of food, how they adapt to their habitants and development of their gonads [25]. The overall mean of condition factor obtained in this study for K1 is 1.64 and for K2 is 1.04, in which K1 is within range of the result reported by Sogbesan et al. who recorded a mean condition factor of 1.61 for C. gariepinus fed treated Duckweed and Anyanwu et al. (2007) recorded condition factor of 0.654 for C. gariepinus reared in recirculatory system [26]. The reduction in K2 might due to changing of environment from hatchery condition to laboratory condition, imported feed to local feed, extraneous factor and as fish grow bigger the condition factor reduces.
Hepatosomatic index and viscerosomatic index are used to determine health status of fish in which an increase in hepatosomatic index is an indication of energy reserve in fish. In a poor environment, fish usually have smaller liver (with less energy reserved in the liver) (EPD) [24]. The increase in value of hepatosomatic and viscerosomatic indices might be due to bioactive chemicals in the additive and this result agreed with Keri et al. who reported that addition of maltose (basal additive) to fish diet increase and improve fish condition in terms of hepato and visceral somatic indices which is an indication good health status of fish in experimental diet than the control and was also supported by (EPD) On the basis of cost benefit ratio, this research has indicated that net profit and benefit cost ratio and profit index increase with increased level of additive. For cost of feed, cost of feeding, incidence of cost and estimate investment mean cost reduces with increased level of additives. This results corresponded with the report of Sogbesan et al. that highest net profit, profit index, estimate investment cost and low benefit cost ratio were recorded in control diet compared to diet contained treated duckweed fed to Clarias gariepinus [2,27].
References
- FAO (2010) World review of fisheries and aquaculture.
- Sogbesan OA, Ekundayo TM (2014) Cost benefit of fermented groundnut shell ,meal as supplemented feed in the diets of Clarias gariepinus. Nigeria J Fisheries Aquacul 2: 34-35.
- Blazer VS (1992) Nutrition and disease resistance in fish. Annual Revision. Fish Disease 1: 309-323.
- Lall SP, Olivier G (1993) Role of micronutrients in immune response and disease resistance in fish. Int Fish Nutrition Practice 101-118.
- Waagbo R (1997) The impact of nutritional factors on the immune system in Atlantic salmon, Salmo salar L: A review. Aquacul Fisheries Manag 25: 175-197.
- Nadkarni KM (1999) Indian materia medica, 3rd Edition. Popular Prakashan Pvt Ltd: India.
- Effraim KD, Jacks TW, Sodipo OA (2003) Histopathological studies on the toxicity of Ocimum gratissimum leave extract on some organs of rabbit. Africa J Biomed Resou 6: 21-5.
- Ibiyo LMO (2016) Hints on fish nutrition. Easy Ope Printing and Publisher, Nigeria.
- Turan F, Akyurt I (2005) Effect of red clover extract on growth performance and body composition of African catfish Clarias gariepinus (Burchell, 1822). Fish Science 71: 618-620.
- Turan F (2006) Improvement of growth performance in Tilapia (Oreochromis niloticus) by supplementation of red clover (Trifolium pretense) in diet. Israeli J Aquacul Bamidgeh 58: 34-38.
- Soosan C, Marimuthu K, Sudhakaran S, Xavier R (2010) Effect of mangosteen (Garcinia mangostana L.) as a feed additive on growth and haematological parameters of African catfish (Clarias gariepinus) fingerlings. Euro Revision Medicinal Pharmacol Sci 14: 605-611.
- Farahi A, Kasiri M, Sudagar M, Soleimani IM, Zorriehzahra SMJ (2011) Effect of dietary supplementation of Melissa officinalis and Aloe vera on haematological traits, lipid oxidation of Carcass and performance in rainbow trout (Oncorhynchus mykiss). J Animal Feed Resour 2: 1-5.
- Dada AA, Oviawe NE (2011) The use of bitter kola (Garcinia kola) dry seed powder as a natural growth-promoting agent for African sharptooth catfish Clarias gariepinus fingerlings. Africa J Aquatic Sci 36: 97-100.
- Dienye, HE, Olumuji OK (2014) Growth Performance of Clarias gariepinus fed dietary level of Moringa oleifera leaf meal. Net J Agri Sci 2: 79-88.
- Richter N, Siddhruraju A, Becker K (2003) Evaluation of nutritional quality of Moringa oleifera leaves alternative protein source for Tilapia (Oreochromis niloticus). Aquaculture 217: 599-611.
- Offor JI, Ugwuoke CU, Anyanwu DC, Onogu B, Mbachu M (2014) Growth and nutrient responses of Clarias gariepinus fingerlings fed dietary level of Ocimum gratissimum leaf meal. Am J Res Comm 2: 167-177.
- Erfanullah, Jafri AK (1998) Growth response, feed utilization and nutrient retention inCatlacatla (Ham) Fry Fed varying level of dietary carbohydrate. Asian Fisheries Sci 11: 223-230.
- Alegbeleye WO, Oresegun A, Ajitomi OO (2001) An assessment of Jack beans in(Canavalta ensiformis) meal as an ingredient in the diet for Clarias garipinus (Burchell 1822) fingerlings fish nutrition and feed technology, education Eyo AA FISON 92- 97.
- Ochang SN, Fagbenro OA, Adebayo OT (2007) Growth performance, body composition haematology and product quality of the Africa catfish (Clarias gariepinus) fed diet with palm oil. Pak J Nutri 6: 452-459.
- De silva SS, Anderson TA (1995) Fish nutrition in aquaculture champman hall London New York. Tokyo 305.
- Ekelemu JK, Marroh E (2016) Effect of haematology immuno system of Clarais gariepinus fed granded level of Ocimum gratissimum as fed additives. Int J Res Studies Biosci 4: 6-13.
- Adikwu IA (2003) A Review of aquaculture: Nutrition in aquaculture development in Nigeria. In proceeding of the Joint Fisheries Society of Nigeria, Nutrition Institute for Freshwater Fisheries Research, FAO-National special programme for food security National Workshop on Fish Feed Development and feeding practices in Aquaculture (Eyo, A.A. Ed.) held at National Institute for Freshwater Fisheries Rearch, New-Bussa 34-42.
- Ilori M, Sheteolu AO, Omonigbehin EA, Adeneye AA (1996) Anti-bacterial activities Ocimum gratissimum (Lamtaceae). J Diarrh Dise Resour 14: 283-285.
- Junaid SA, Olabode AO, Onwuiri FC, Okwori AEJ, Agina SE (2006) The anti-microbial properties of Ocimum gratissium extract on some selected bacterial gastrointestinal isolates. Africa J Biotech 5: 2315-2321.
- Environmental Protection Development (2015) Condition factor, Hepatosomatic and Gonadosomatic indices. The government of Hong Kong special administrative region 1-2.
- Sogbesan OA, Onoja CF, Adedeji HA, Idowu TA (2015) Utilization of treatedduckweed meal (Lemna pausicostata) as plant protein supplement in African mud catfish (Clarias gariepinus) juvenile.
- Keri AI, Aziz BA, Abol-Munafi (2014) The selection of viscerosomatic and hepatosomatic indices for the measurement and analysis of Oreochromis niloticus condition fed with varying dietary maltose levels. Int J Fauna Bio Sci 1: 18-20.

Open Access Journals
- Aquaculture & Veterinary Science
- Chemistry & Chemical Sciences
- Clinical Sciences
- Engineering
- General Science
- Genetics & Molecular Biology
- Health Care & Nursing
- Immunology & Microbiology
- Materials Science
- Mathematics & Physics
- Medical Sciences
- Neurology & Psychiatry
- Oncology & Cancer Science
- Pharmaceutical Sciences