Dietary Bioprocessed Soybean Meal Does Not Affect the Growth of Exercised Juvenile Rainbow Trout (Oncorhynchus mykiss)
Voorhees JM, Barnes ME, Chipps SR and Brown ML
DOI10.21767/2572-5459.100050
Voorhees JM1, Barnes ME1*, Chipps SR2 and Brown ML3
1Department of Game, Fish and Parks, McNenny State Fish Hatchery, South Dakota, USA
2U.S. Geological Survey, South Dakota Cooperative Fish and Wildlife Research Unit, Department of Natural Resource Management, South Dakota State University, Brookings, South Dakota, USA
3Department of Natural Resource Management, South Dakota State University, Brookings, South Dakota, USA
- *Corresponding Author:
- Barnes ME
Department of Game, Fish and Parks McNenny State Fish Hatchery
South Dakota, USA
Tel: 605-645-1262
Fax: 605-642-6921
E-mail: mike.barnes@state.sd.us
Received date: August 09, 2018; Accepted date: September 28, 2018; Published date: October 05, 2018
Citation: Voorhees JM, Barnes ME, Chipps SR, Brown ML(2018) Dietary Bioprocessed Soybean Meal Does Not Affect the Growth of Exercised Juvenile Rainbow Trout (Oncorhynchus mykiss). J Anim Res Nutr 3: 2: 6. doi: 10.21767/2572-5459.100050
Copyright: © 2018 Voorhees JM, et al. This is an open-access article distributed under the terms of the Creative Commons Attribution License, which permits unrestricted use, distribution, and reproduction in any medium, provided the original author and source are credited.
Abstract
Context: This 88-day experiment evaluated the rearing performance of juvenile rainbow trout (Oncorhynchus mykiss) fed one of three isonitrogenous and isocaloric diets and reared at velocities of either 2.3 or 18.7 cm s-1.
Objective: Evaluate the effects of diet and exercise during rainbow trout rearing.
Design: Fishmeal was the primary protein source for one diet, with bioprocessed soybean meal (BSM) replacing either 60 or 85% of the fishmeal in the other two diets.
Setting: This study was performed at Cleghorn Springs State Fish Hatchery in Rapid City, South Dakota, USA.
Results: At the end of the experiment there were no significant differences among the dietary treatments in gain, percent gain, specific growth rate (SGR), or percent mortality. However, fish fed the fishmeal-based diet ate significantly more, experienced a significantly higher feed conversion ratio (FCR), and had a significantly higher hepatosomatic index than the fish fed the 85% BSM diet. Intestinal histology was not affected by the inclusion of BSM. Fish reared at 2.3 cm/s-1 had significantly lower FCRs, gain, percent gain, and SGR than the fish reared at 18.7 cm/ s-1. There was a significant interaction in food consumed between diet and velocity, but no other significant interactions between the dietary and exercise treatments were observed.
Conclusion: Based on these results, BSM can replace at least 85% of the fishmeal in juvenile rainbow trout, even if the fish are exercised.
Keywords:
Alternative protein; Plant-based diets; Salmonids; Feed formulation; Velocity
Abbreviations
BSM: Bioprocessed Soybean Meal; FCR: Feed Conversion Ratio; SGR: Specific Growth Rate; HSI: Hepatosomatic Index; SSI: Splenosomatic Index; VSI: Viscerosomatic Index; K: Condition Factor
Introduction
With the large increase in aquaculture production, there has been a corresponding increase in aquafeeds [1]. Fishmeal has historically been the primary protein source in feeds for carnivorous fish, like rainbow trout (Oncorhynchus mykiss) [2-4]. However, fishmeal is primarily made from small pelagic marine fish, and the supply of these capture fisheries has not increased correspondingly to the increase in aquaculture production, creating a need for alternative protein sources [1]. Plant-based proteins are a prime candidate due to wide availability and relatively favorable pricing in comparison to fishmeal [5].
Of the plant-based proteins, soybeans (Glycine max) are one of the leading alternatives to fishmeal [6,7], due to relatively high palatability [8-10], high protein levels, and balanced amino acid profiles [5,11]. However, soybean meal contains antinutritional factors that hinder fish digestion [11-13], and can cause gastro-intestinal issues, such as enteritis [8,14-16]. In addition, soybean meal has high carbohydrate levels [5,17], which can be especially deleterious to carnivorous fish [11]. For these reasons, soybean meal inclusion in carnivorous fish aquafeeds has been limited.
Soybean meal antinutritional factors can be decreased or eliminated. Heat applied during the feed extrusion process decreases lectins and proteinase inhibitors [5,18,19]. Saponins, sterols, and oligosaccharides can be decreased by alcohol extraction [19]. Bioprocessing, such as fermentation, has also been shown to eliminate or reduce antinutritional factors [20-23].
In addition to diet, exercise has been shown to affect fish rearing performance [24-27]. When fish are fed to satiation, exercise produces improved growth and feed conversion ratios (FCR), [27,28]. However, if feed is limited, growth can be impaired at higher velocities [26]. The interaction between dietary composition and exercise has not been investigated. Thus, there is no published information on how the replacement of fishmeal with plant-based proteins, such as soybean meal, may impact the response of fish forced to exercise by being subjected to higher water velocities. The objective of this experiment was to examine the effects of bioprocessed soybean meal (BSM) diets and velocity on juvenile rainbow trout rearing performance.
Materials and Methods
All experimentation occurred at Cleghorn Springs State Fish Hatchery, Rapid City, South Dakota, USA. Spring water (11°C; total hardness as CaCO3, 360 mg L-1; alkalinity as CaCO3, 210 mg L-1; pH, 7.6; total dissolved solids, 390 mg L-1) was used throughout this 88-day study. On August 4, 2016, 20 randomlyselected Shasta strain rainbow trout (initial weight 48.8 ± 0.5 g, length 156.8 ± 0.5 mm, mean ± SE) were placed into each of 18 circular fiberglass tanks (1.8 m diameter, 0.6 m water depth). Three hundred and sixty total fish were used. The 3 × 2 experimental design used three diets and two water velocities, with three tanks per treatment (Table 1).
| Diet (% BSMa) | Velocity | Velocity (cm s-1) | |||||
|---|---|---|---|---|---|---|---|
| Treatment | N | 1 (0) | 2 (60) | 3 (85) | Low | High | |
| 1 | 3 | X | X | 2.3 ± 0.3 | |||
| 2 | 3 | X | X | 18.7 ± 0.8 | |||
| 3 | 3 | X | X | 2.3 ± 0.3 | |||
| 4 | 3 | X | X | 18.7 ± 0.8 | |||
| 5 | 3 | X | X | 2.3 ± 0.3 | |||
| 6 | 3 | X | X | 18.7 ± 0.8 | |||
| aBioprocessed soybean meal (BSM) | |||||||
Table 1: Study design for dietary and velocity treatments (N=3), and mean (± SE) water velocities.
The three dietary treatments consisted of bioprocessed soybean meal replacing 0, 60, or 85% of the dietary fishmeal, with fishmeal being the primary protein source in the 0% treatment (Table 2).
| Chemical analysis (% dry basis) | Diet (% BSM) | ||
|---|---|---|---|
| Ingredients | 1 (0) | 2 (60) | 3 (85) |
| Fishmeala | 35 | 14 | 4.7 |
| Bioprocessed soybean mealb | 0 | 21 | 30.3 |
| Wheat middsc | 12 | 10 | 10 |
| Whole wheatc | 17.7 | 15.2 | 15.1 |
| Poultry byproduct meald | 10 | 15 | 15 |
| Blood meale | 2 | 2 | 2 |
| Feather meald | 7 | 2.5 | 2.5 |
| Vitamin premixf | 1.3 | 1.3 | 1.3 |
| Mineral premixf | 0.8 | 2 | 2 |
| Micro-mineral premixf | 0.8 | 0.8 | 0.8 |
| Choline chlorideg | 0.6 | 0.6 | 0.7 |
| L-Lysineh | 1.5 | 2 | 2 |
| L-Methioninei | 0.3 | 0.5 | 0.5 |
| Stay-C 35j | 0.2 | 0.2 | 0.2 |
| Fish oilk | 11 | 13 | 13 |
| Total | 100 | 100 | 100 |
| Protein | 43.18 | 43.85 | 43.84 |
| Lipid | 15.91 | 14.28 | 16.44 |
| Ash | 2.42 | 3.6 | 3.92 |
| Nitrogen-free extract | 20.48 | 24.33 | 23.96 |
| Dry matter | 93 | 95.2 | 96.25 |
| Gross Energy (kJ/g) | 16.5 | 16 | 16.8 |
| Protein: Energy (MJ/g) | 26.2 | 27.4 | 26 |
| aSpecial Select, Omega Protein, Houston, TX; b SDSU; cConsumer Supply, Sioux City, IA; dTyson Foods, Springdale, AR; eMason City Byproducts, Mason City, IA; fNutraBlend, Neosho, MO; gBalchem, New Hampton, NY; hCJ Bio America, Fort Dodge, IA; iAdisseo USA, Alpharreta, GA; jDSM Nutritional Products, Ames, IA; kVirginia Prime Gold, Omega Protein, Houston, TX. | |||
Table 2: Diet formulation and composition analyses of the diets used in the 88-day trial. Analysis conducted on post-extrusion feed pellets.
All three of the diets were isocaloric and isonitrogenous, and were prepared using an extruder (ExtruTech model 325, Sabetha, KS, USA). The bioprocessed soybean meal was produced using a proprietary microbial conversion process (SDSU, Brookings, SD, USA). Feed was analyzed according to Association of Official Analytical Chemists [29] method 2001. 11 for protein, 2003.5 (modified by substituting petroleum ether for diethyl ether) for crude lipid, and American Association of Cereal Chemists [30] method 08-03 for ash content.
The two water velocity treatments were either 2.3 or 18.7 cm s-1, with in tank velocities recorded mid-depth behind the spraybar with a Flowatch flowmeter (JDC Electronic SA, Yverdonles- Bains, Jura-Nord Vaudois, Vaud, Switzerland). Flow rates remained constant throughout the study.
At the start of the experiment and then approximately every four weeks thereafter, all of the fish in each tank were individually weighed to the nearest 0.1 g and measured (total length) to the nearest 1.0 mm. Total tank weights were obtained by summing the individual fish weights. Fish were fed daily for 88 days, except on days 29 and 60 when the fish were weighed and measured. Feeding amounts were initially determined by the hatchery constant method [31], using an anticipated feed conversion ratio of 1.1 and growth rate of 0.08 cm day-1. These values were based on the previous rearing performance of Shasta strain rainbow trout at Cleghorn Springs State Fish Hatchery. Feed amounts were adjusted as needed to ensure that fish were fed at, or slightly above, satiation. Fish were fed by hand, with feed amounts and mortality recorded daily.
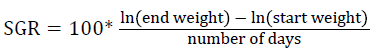
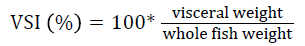
Prior to collecting weight and length data, the fish were anesthetized using 60 mg L-1 MS-222 (Tricaine-S, tricaine methanesulfonate, Syndel USA, Ferndale, Washington). At the end of the experiment, a lethal dose of 250 mg L-1 MS-222 was used to euthanize five fish per tank [32]. Data collected from these five fish included weight, length, fin lengths (to the nearest 1.0 mm), and spleen, liver, and visceral weights (to the nearest 1.0 mg). Relative fin lengths [33], hepatosomatic index (HSI) [34], splenosomatic index (SSI) [35], and viscerosomatic index (VSI) [35] were calculated using the following formulas:
Gain = end weight – start weight


From the five fish sampled at the end of the study, a 2 mm wide section of the distal intestine was removed for histological examination [36-39]. This tissue sample was immediately preserved using 10% buffered formalin, prior to staining with haematoxylin and eosin using standard histological techniques [40,41]. Intestinal inflammation was assessed using an ordinal scoring system (Table 3) based on the thickness of cellularity of the lamina propria, the width of the submucosal connective tissue, and distribution of the leukocytes [42-44].
| Score | Appearance |
|---|---|
| Lamina propria of simple folds | |
| 1 | Thin and delicate core of connective tissue in all simple folds. |
| 2 | Lamina propria slightly more distinct and robust in some of the folds. |
| 3 | Clear increase in lamina propria in most of simple folds. |
| 4 | Thick lamina propria in many folds. |
| 5 | Very thick lamina propria in many folds. |
| Connective tissue between base of folds and stratum compactum | |
| 1 | Very thin layer of connective tissue between base of folds and stratum compactum. |
| 2 | Slightly increased amount of connective tissue beneath some of mucosal folds. |
| 3 | Clear increase of connective tissue beneath most of the mucosal folds. |
| 4 | Thick layer of connective tissue beneath many folds. |
| 5 | Extremely thick layer of connective tissue beneath some of the folds. |
| Vacuoles | |
| 1 | Large vacuoles absent. |
| 2 | Very few large vacuoles present. |
| 3 | Increased number of large vacuoles. |
| 4 | Large vacuoles are numerous. |
| 5 | Large vacuoles are abundant in present in most epithelial cells. |
Table 3: Histological scoring system used on rainbow trout fed fishmeal or bioprocessed soybean meal in diets ([42]; modified from: [35]).
Data was analyzed using the SPSS (9.0) statistical analysis program (SPSS, Chicago Illinois). Two-way analysis of variance (ANOVA) was conducted with post hoc mean separation tests performed using Tukey’s HSD comparison procedure. Significance was predetermined at P<0.05.
Results
At the end of this experiment there were no significant differences in gain, percent gain, SGR, or percent mortality among the three diets (Table 4). However, food fed and FCR were significantly different between the fishmeal reference and 85% BSM diets. Overall mean (± SE) FCRs were 1.09 (± 0.04), 1.04 (± 0.01), and 0.97 (± 0.02) for the fishmeal, 60%, and 85% diets, respectively. FCR was also significantly poorer in the fishmeal treatment in rearing periods 2 (days 30-60) and 3 (days 61-88). There were no significant differences among the diets in individual fish weight, length, condition factor, fin indices, splenosomatic index, viscerosomatic index, or any of the histology scores (Table 5).
| Parameters | Velocity | Diet (% BSM) | |||
|---|---|---|---|---|---|
| 1 (0) | 2 (60) | 3 (85) | Overall | ||
| Initial | |||||
| Start weight (g) | Low | 975.3 ± 8.6 | 973.8 ± 16.4 | 999.7 ± 6.9 | 982.9 ± 7.1 |
| High | 969.1 ± 29.8 | 980.5 ± 37.2 | 950.8 ± 26.4 | 966.8 ± 16.3 | |
| Overall | 972.2 ± 13.9 | 977.1 ± 18.2 | 975.2 ± 16.4 | ||
| Days 1-29 | |||||
| End weight (g) | Low | 1,375.0 ± 14.3 | 1,291.4 ± 38.0 | 1,343.4 ± 33.1 | 1,330.6 ± 18.1 |
| High | 1,330.6 ± 36.9 | 1,333.1 ± 60.6 | 1,232.5 ± 42.1 | 1,298.7 ± 29.0 | |
| Overall | 1,343.8 ± 18.7 | 1,312.2 ± 33.3 | 1,288.0 ± 34.5 | ||
| Gain (g) | Low | 381.7 ± 11.5 | 317.6 ± 25.3 | 343.7 ± 35.7 | 347.7 ± 16.1 |
| High | 361.5 ± 19.0 | 352.6 ± 27.0 | 281.7 ± 25.2 | 331.9 ± 17.4 | |
| Overall | 371.6 ± 10.9 | 335.1 ± 18.3 | 312.7 ± 24.0 | ||
| Gain (%) | Low | 39.1 ± 1.2 | 32.6 ± 2.3 | 34.4 ± 3.7 | 35.4 ± 1.6 |
| High | 37.4 ± 2.1 | 35.9 ± 1.9 | 29.6 ± 2.5 | 34.3 ± 1.6 | |
| Overall | 38.3 ± 1.2 | 34.2 ± 1.5 | 32.0 ± 2.3 | ||
| Food fed (g) | Low | 403 ± 8 | 338 ± 19 | 375 ± 20 | 372 ± 12 |
| High | 455 ± 11 | 385 ± 28 | 354 ± 6 | 398 ± 17 | |
| Overall | 429 ± 13 z | 362 ± 18 y | 365 ± 10 y | ||
| FCR | Low | 1.06 ± 0.04 | 1.07 ± 0.03 | 1.10 ± 0.06 | 1.08 ± 0.02 y |
| High | 1.26 ± 0.04 | 1.09 ± 0.01 | 1.28 ± 0.11 | 1.21 ± 0.04 z | |
| Overall | 1.16 ± 0.05 | 1.08 ± 0.02 | 1.19 ± 0.07 | ||
| SGR | Low | 1.10 ± 0.03 | 0.94 ± 0.06 | 0.98 ± 0.09 | 1.01 ± 0.04 |
| High | 1.06 ± 0.05 | 1.02 ± 0.05 | 0.86 ± 0.06 | 0.98 ± 0.04 | |
| Overall | 1.08 ± 0.03 | 0.98 ± 0.04 | 0.92 ± 0.06 | ||
| Days 30-60 | |||||
| End weight (g) | Low | 2,175.1 ± 50.4 | 2,110.4 ± 76.7 | 2,265.6 ± 44.8 | 2,183.7 ± 37.1 |
| High | 2,295.4 ± 63.6 | 2,359.4 ± 116.7 | 2,113.4 ± 71.4 | 2,256.1 ± 57.0 | |
| Overall | 2,235.2 ± 45.2 | 2,234.9 ± 83.7 | 2,189.5 ± 50.8 | ||
| Gain (g) | Low | 818.1 ± 46.7 | 819.0 ± 40.9 | 922.2 ± 14.8 | 853.1 ± 25.3 y |
| High | 964.8 ± 27.2 | 1,026.3 ± 57.9 | 877.5 ± 55.2 | 956.2 ± 32.6 z | |
| Overall | 891.4 ± 40.8 | 922.6 ± 56.2 | 899.9 ± 27.4 | ||
| Gain (%) | Low | 60.3 ± 3.5 | 63.4 ± 1.7 | 68.7 ± 1.2 | 64.1 ± 1.7 y |
| High | 72.5 ± 0.5 | 76.9 ± 1.6 | 71.3 ± 4.9 | 73.6 ± 1.7 z | |
| Overall | 66.4 ± 3.1 | 70.1 ± 3.2 | 70.0 ± 2.3 | ||
| Food fed (g) | Low | 783 ± 18 | 794 ± 43 | 801 ± 19 | 793 ± 15 y |
| High | 987 ± 13 | 1,018 ± 52 | 819 ± 37 | 941 ± 36 z | |
| Overall | 885 ± 47 zy | 906 ± 58 z | 810 ± 19 y | ||
| FCR | Low | 0.96 ± 0.04 | 0.97 ± 0.00 | 0.87 ± 0.01 | 0.93 ± 0.02 y |
| High | 1.02 ± 0.04 | 0.99 ± 0.01 | 0.94 ± 0.02 | 0.98 ± 0.02 z | |
| Overall | 0.99 ± 0.03 z | 0.98 ± 0.01 z | 0.90 ± 0.02 y | ||
| SGR | Low | 1.57 ± 0.07 | 1.64 ± 0.03 | 1.74 ± 0.02 | 1.65 ± 0.04 y |
| High | 1.82 ± 0.01 | 1.90 ± 0.03 | 1.79 ± 0.09 | 1.84 ± 0.03 z | |
| Overall | 1.69 ± 0.06 | 1.77 ± 0.06 | 1.77 ± 0.04 | ||
| Days 61-88 | |||||
| End weight (g) | Low | 3,196.8 ± 157.0 | 3,076.4 ± 106.9 | 3,347.0 ± 71.6 | 3,206.7 ± 70.5 |
| High | 3,492.5 ± 187.2 | 3,662.0 ± 161.4 | 3,238.9 ± 200.3 | 3,464.5 ± 107.1 | |
| Overall | 3,344.6 ± 127.7 | 3,369.2 ± 151.3 | 3,293.0 ± 98.2 | ||
| Gain (g) | Low | 1,021.7 ± 107.8 | 966.0 ± 34.0 | 1,081.4 ± 46.8 | 1,023.0 ± 39.0 y |
| High | 1,197.1 ± 125.0 | 1,302.7 ± 25.6 | 1,128.8 ± 127.8 | 1,209.5 ± 57.9 z | |
| Overall | 1,109.4 ± 83.6 | 1,134.4 ± 77.6 | 1,105.1 ± 61.8 | ||
| Gain (%) | Low | 46.8 ± 4.0 | 45.8 ± 0.9 | 47.7 ± 2.0 | 46.8 ± 1.3 y |
| High | 51.9 ± 4.2 | 55.4 ± 2.5 | 53.2 ± 4.5 | 53.5 ± 2.0 z | |
| Overall | 49.4 ± 2.8 | 50.6 ± 2.5 | 50.5 ± 2.5 | ||
| Food fed (g) | Low | 1,099 ± 71 | 1,027 ± 36 | 1,037 ± 39 | 1,054 ± 28 y |
| High | 1,415 ± 41 | 1,421 ± 43 | 1,108 ± 96 | 1,315 ± 61 z | |
| Overall | 1,257 ± 80 z | 1,224 ± 92 zy | 1,072 ± 49 y | ||
| FCR | Low | 1.09 ± 0.05 | 1.06 ± 0.02 | 0.96 ± 0.02 | 1.04 ± 0.02 y |
| High | 1.20 ± 0.10 | 1.09 ± 0.02 | 0.99 ± 0.3 | 1.09 ± 0.04 z | |
| Overall | 1.14 ± 0.06 z | 1.08 ± 0.01 zy | 0.97 ± 0.02 y | ||
| SGR | Low | 1.28 ± 0.09 | 1.26 ± 0.02 | 1.30 ± 0.05 | 1.28 ± 0.03 y |
| High | 1.39 ± 0.09 | 1.47 ± 0.05 | 1.42 ± 0.10 | 1.43 ± 0.04 z | |
| Overall | 1.33 ± 0.06 | 1.36 ± 0.05 | 1.36 ± 0.06 | ||
| Overall (Days 1-88) | |||||
| Gain (g) | Low | 2,221.4 ± 148.4 | 2,102.6 ± 92.5 | 2,347.3 ± 78.2 | 2,223.8 ± 65.6 y |
| High | 2,523.4 ± 158.5 | 2,681.6 ± 94.2 | 2,288.1 ± 176.4 | 2,497.7 ± 93.2 z | |
| Overall | 2,372.4 ± 118.3 | 2,392.1 ± 142.3 | 2,317.7 ± 87.3 | ||
| Gain (%) | Low | 227.5 ± 13.3 | 215.8 ± 6.7 | 234.9 ± 9.4 | 226.1 ± 5.8 y |
| High | 259.9 ± 9.2 | 273.6 ± 1.1 | 240.1 ± 13.3 | 257.8 ± 6.8 z | |
| Overall | 243.7 ± 10.2 | 244.7 ± 13.3 | 237.5 ± 7.4 | ||
| Food fed (g) | Low | 2,285 ± 81 | 2,159 ± 94 | 2,213 ± 73 | 2,219 ± 46 y |
| High | 2,856 ± 26 | 2,823 ± 111 | 2,281 ± 131 | 2,654 ± 106 z | |
| Overall | 2,570 ± 133 z | 2,491 ± 162 zy | 2,247 ± 69 y | ||
| FCR | Low | 1.03 ± 0.04 | 1.03 ± 0.01 | 0.94 ± 0.00 | 1.00 ± 0.02 y |
| High | 1.14 ± 0.06 | 1.05 ± 0.01 | 1.00 ± 0.02 | 1.06 ± 0.03 z | |
| Overall | 1.09 ± 0.04 z | 1.04 ± 0.01 zy | 0.97 ± 0.02 y | ||
| SGR | Low | 1.35 ± 0.05 | 1.31 ± 0.02 | 1.37 ± 0.03 | 1.34 ± 0.02 y |
| High | 1.46 ± 0.03 | 1.50 ± 0.00 | 1.39 ± 0.03 | 1.45 ± 0.02 z | |
| Overall | 1.40 ± 0.04 | 1.40 ± 0.04 | 1.38 ± 0.02 | ||
| Mortality (%) | Low | 0.00 ± 0.00 | 1.67 ± 1.67 | 0.00 ± 0.00 | 0.56 ± 0.56 |
| High | 1.67 ± 1.67 | 0.00 ± 0.00 | 3.33 ± 1.67 | 1.67 ± 0.83 | |
| Overall | 0.83 ± 0.83 | 0.83 ± 0.83 | 1.67 ± 1.05 | ||
| aFCR=feed conversion ratio=total food fed / total weight gain. | |||||
| bSGR=100 × [(Ln(final weight)–Ln(initial weight))/days] | |||||
Table 4: Mean (± SE) gain, percent gain, food fed, feed conversion ratio (FCRa), specific growth rate (SGRb), and mortality of rainbow trout receiving one of three different diets containing fishmeal or bioprocessed soybean meal (BSM) as the main protein ingredient and reared at two different velocities. Overall means with different letters in the same column or row differ significantly (P<0.05).
| Parameters | Velocity | Diet (% BSM) | |||
|---|---|---|---|---|---|
| 1 (0) | 2 (60) | 3 (85) | Overall | ||
| Initial | |||||
| Weight (g) | Low | 48.8 ± 0.4 | 48.7 ± 0.8 | 50.0 ± 0.3 | 49.1 ± 0.4 |
| High | 48.4 ± 1.5 | 48.9 ± 1.8 | 47.5 ± 1.3 | 48.3 ± 0.8 | |
| Overall | 48.6 ± 0.7 | 48.8 ± 0.9 | 48.8 ± 0.8 | ||
| Total length (mm) | Low | 156.4 ± 0.8 | 157.0 ± 1.2 | 158.2 ± 0.6 | 157.2 ± 0.5 |
| High | 156.4 ± 1.8 | 156.8 ± 1.6 | 156.1 ± 1.7 | 156.4 ± 0.9 | |
| Overall | 156.4 ± 0.9 | 156.9 ± 0.9 | 157.1 ± 1.0 | ||
| K | Low | 1.26 ± 0.02 | 1.25 ± 0.01 | 1.25 ± 0.01 | 1.25 ± 0.01 |
| High | 1.25 ± 0.01 | 1.25 ± 0.00 | 1.24 ± 0.01 | 1.25 ± 0.01 | |
| Overall | 1.25 ± 0.01 | 1.25 ± 0.00 | 1.25 ± 0.01 | ||
| Days 1-29 | |||||
| End weight (g) | Low | 67.9 ± 0.7 | 64.8 ± 1.7 | 57.2 ± 1.7 | 66.6 ± 0.9 |
| High | 66.5 ± 1.8 | 66.7 ± 3.0 | 62.7 ± 1.8 | 65.3 ± 1.3 | |
| Overall | 67.2 ± 0.9 | 65.7 ± 1.6 | 64.9 ± 1.5 | ||
| Total end length (mm) | Low | 177.4 ± 0.8 | 176.3 ± 1.3 | 178.5 ± 1.7 | 177.4 ± 0.7 |
| High | 176.3 ± 2.1 | 176.8 ± 2.6 | 174.3 ± 2.1 | 175.8 ± 1.2 | |
| Overall | 176.8 ± 1.0 | 176.6 ± 1.3 | 176.4 ± 1.5 | ||
| K | Low | 1.19 ± 0.00 | 1.17 ± 0.01 | 1.33 ± 0.16 | 1.23 ± 0.05 |
| High | 1.19 ± 0.1 | 1.19 ± 0.00 | 1.17 ± 0.01 | 1.18 ± 0.01 | |
| Overall | 1.19 ± 0.01 | 1.18 ± 0.01 | 1.25 ± 0.08 | ||
| Days 30-60 | |||||
| End weight (g) | Low | 108.7 ± 2.5 | 106.4 ± 3.2 | 113.3 ± 2.25 | 109.5 ± 1.7 |
| High | 114.8 ± 3.2 | 118.0 ± 5.8 | 107.5 ± 4.4 | 113.4 ± 2.8 | |
| Overall | 111.8 ± 2.3 | 110.4 ± 2.6 | 110.4 ± 2.6 | ||
| Total end length (mm) | Low | 205.5 ± 2.6 | 204.6 ± 2.4 | 208.1 ± 2.0 | 206.1 ± 1.3 |
| High | 206.5 ± 2.2 | 207.2 ± 2.0 | 201.9 ± 3.1 | 205.2 ± 1.5 | |
| Overall | 206.0 ± 1.5 | 205.9 ± 1.5 | 205.0 ± 2.2 | ||
| K | Low | 1.22 ± 0.01 | 1.22 ± 0.01 | 1.24 ± 0.01 | 1.23 ± 0.01 |
| High | 1.26 ± 0.01 | 1.38 ± 0.10 | 1.26 ± 0.01 | 1.30 ± 0.04 | |
| Overall | 1.24 ± 0.01 | 1.30 ± 0.06 | 1.25 ± 0.01 | ||
| Days 61-88 (Final) | |||||
| End weight (g) | Low | 159.8 ± 7.8 | 155.4 ± 3.9 | 167.4 ± 3.6 | 160.9 ± 3.2 y |
| High | 177.4 ± 6.7 | 183.1 ± 6.6 | 167.5 ± 13.3 | 176.0 ± 5.2 z | |
| Overall | 168.6 ± 6.1 | 169.2 ± 7.1 | 167.4 ± 6.18 | ||
| Total end length (mm) | Low | 230.0 ± 5.7 | 232.0 ± 1.7 | 235.6 ± 2.3 | 232.5 ± 2.0 |
| High | 233.5 ± 2.4 | 248.7 ± 12.7 | 231.8 ± 5.8 | 238.0 ± 4.9 | |
| Overall | 231.8 ± 2.9 | 240.4 ± 6.8 | 233.7 ± 2.9 | ||
| K | Low | 1.36 ± 0.10 | 1.22 ± 0.01 | 1.26 ± 0.02 | 1.28 ± 0.03 |
| High | 1.34 ± 0.02 | 1.31 ± 0.02 | 1.30 ± 0.02 | 1.32 ± 0.01 | |
| Overall | 1.35 ± 0.04 | 1.27 ± 0.02 | 1.28 ± 0.02 | ||
| Pectoral index (%) | Low | 11.64 ± 0.70 | 10.76 ± 0.14 | 10.63 ± 0.17 | 11.01 ± 0.27 |
| High | 10.65 ± 0.33 | 10.48 ± 0.18 | 10.82 ± 0.05 | 10.65 ± 0.12 | |
| Overall | 11.14 ± 0.41 | 10.62 ± 0.12 | 10.73 ± 0.09 | ||
| Pelvic index (%) | Low | 9.14 ± 1.02 | 9.33 ± 0.06 | 9.10 ± 0.12 | 9.19 ± 0.30 |
| High | 9.29 ± 0.14 | 8.66 ± 0.34 | 8.43 ± 0.40 | 8.79 ± 0.20 | |
| Overall | 9.22 ± 0.46 | 8.99 ± 0.22 | 8.76 ± 0.24 | ||
| Dorsal index (%) | Low | 5.60 ± 0.64 | 4.74 ± 0.42 | 4.39 ± 0.04 | 4.91 ± 0.29 |
| High | 4.82 ± 0.05 | 4.49 ± 0.14 | 4.68 ± 0.16 | 4.66 ± 0.08 | |
| Overall | 5.21 ± 0.34 | 4.62 ± 0.20 | 4.53 ± 0.10 | ||
| HSI (%) | Low | 1.40 ± 0.06 | 1.28 ± 0.04 | 1.12 ± 0.08 | 1.27 ± 0.05 |
| High | 1.33 ± 0.08 | 1.27 ± 0.02 | 1.21 ± 0.05 | 1.27 ± 0.03 | |
| Overall | 1.37 ± 0.05 z | 1.27 ± 0.02 zy | 1.16 ± 0.05 y | ||
| SSI (%) | Low | 0.06 ± 0.01 | 0.06 ± 0.01 | 0.05 ± 0.00 | 0.06 ± 0.00 |
| High | 0.05 ± 0.00 | 0.05 ± 0.00 | 0.06 ± 0.01 | 0.05 ± 0.00 | |
| Overall | 0.06 ± 0.00 | 0.05 ± 0.01 | 0.06 ± 0.00 | ||
| VSI (%) | Low | 11.38 ± 0.28 | 12.01 ± 0.41 | 11.29 ± 0.61 | 11.56 ± 0.25 y |
| High | 12.61 ± 0.34 | 13.30 ± 0.24 | 12.38 ± 0.84 | 12.77 ± 0.30 z | |
| Overall | 12.00 ± 0.34 | 12.66 ± 0.36 | 11.84 ± 0.53 | ||
| Lamina propriaf | Low | 1.47 ± 0.29 | 1.67 ± 0.24 | 1.67 ± 0.19 | 1.60 ± 0.13 |
| High | 1.67 ± 0.17 | 1.52 ± 0.26 | 1.72 ± 0.06 | 1.63 ± 0.01 | |
| Overall | 1.57 ± 0.16 | 1.59 ± 0.16 | 1.69 ± 0.09 | ||
| Connective tissuef | Low | 1.25 ± 0.25 | 1.47 ± 0.29 | 1.42 ± 0.42 | 1.38 ± 0.17 |
| High | 1.17 ± 0.17 | 1.45 ± 0.23 | 1.30 ± 0.10 | 1.31 ± 0.10 | |
| Overall | 1.21 ± 0.14 | 1.46 ± 0.17 | 1.36 ± 0.19 | ||
| Vacuolesf | Low | 1.97 ± 0.17 | 2.13 ± 0.24 | 2.00 ± 0.00 | 2.04 ± 0.09 |
| High | 2.17 ± 0.17 | 2.27 ± 0.27 | 1.80 ± 0.20 | 2.08 ± 0.13 | |
| Overall | 2.07 ± 0.11 | 2.20 ± 0.16 | 1.90 ± 0.10 | ||
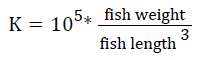
| aK=105 × [weight/(length3)] | |||||
| bFin indices=100 × (fin length/fish length) | |||||
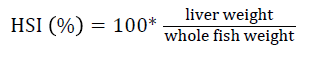
| cHSI=100 × (liver weight/body weight) | |||||
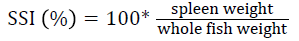
| dSSI=100 × (spleen weight/body weight) | |||||
| eVSI=100 × (visceral weight/body weight) | |||||
| fScoring Parameters in Table 3. | |||||
Table 5: Mean (± SE) condition factor (Ka), fin indicesb, hepatosomatic index values (HSIc), splenosomatic index (SSId), viscerosomatic index (VSIe), and histology scores for lamina propria, connective tissue, and vacuoles of rainbow trout fed one of three diets containing either fishmeal or bioprocessed soybean meal (BSM) as the primary protein source and reared at two different velocities. Means with different letters in the same column or row differ significantly (P<0.05).
However, HSI was significantly different between the fishmeal and the 85% BSM diets. Mean (± SE) HSI was 1.37 (± 0.05), 1.27 (± 0.02), and 1.16 (± 0.05) for the fishmeal, 60, and 85% BSM diets, respectively.
Gain, percent gain, food fed, FCR, and SGR, were all significantly greater in the higher velocity treatment in each of the last two rearing periods, as well as for the entire study duration. At the end of the experiment, trout were significantly heavier in the higher velocity tanks compared to the lower velocity tanks. VSI was also significantly greater in the fish reared at the higher velocity. There were no significant differences at the end of the experiment in total fish length, condition factor, fin indices, hepatosomatic index, splenosomatic index, or gut histology scores. Representative images of the distal intestines from fish fed each diet used for the scoring are shown in Figures 1-6. Percent mortality was similar between velocity treatments.

Figure 1: Distal intestine of rainbow trout receiving 0% bioprocessed soybean meal, and in a low velocity tank.

Figure 2: Distal intestine of rainbow trout receiving 0% bioprocessed soybean meal, and in a high velocity tank.

Figure 3: Distal intestine of rainbow trout receiving 0% bioprocessed soybean meal, and in a high velocity tank.

Figure 4: Distal intestine of rainbow trout receiving 60% bioprocessed soybean meal, and in a high velocity tank.

Figure 5: Distal intestine of rainbow trout receiving 85% bioprocessed soybean meal, and in a low velocity tank.

Figure 6: Distal intestine of rainbow trout receiving 85% bioprocessed soybean meal, and in a high velocity tank.
There was a significant interaction between diet and velocity in food fed in rearing periods 2, 3, and for the entire study duration. The fish at high velocities receiving either the 0 or 60% BSM diets were fed significantly more than fish receiving any of the low velocity dietary treatments, as well as fish fed 85% BSM at high velocity.
Discussion
The results of this study clearly indicate the suitability of BSM as a fishmeal replacement in juvenile rainbow trout diets. This is evident by the similar growth observed among the diets and the improved FCR with 85% BSM diet.
Although there are antinutritional factors associated with soybeans, the lack of differences in growth, gut histology, fin indices, and organosomatic indices shows the bioprocessing technique used has decreased or eliminated many antinutritional factors. Yamamoto et al. [22,23] examined fermented soybean meal and found that 100% of the dietary fishmeal could be replaced by fermented soybean meal without any impact on fish growth or health. Barnes et al. [42,45,46] replaced approximately 60% of the dietary fishmeal with fermented soybean meal, with no decrease in fish health or growth. Similarly, Bruce et al. [47,48] examined BSM and found that approximated 65% of the dietary fishmeal could be replaced without decreasing rearing performance, while Voorhees et al. [49] observed that BSM could replace 100% of the fishmeal in juvenile brown trout (Salmo salar) diets. These studies are part of a growing body of literature indicating that BSM can effectively replace large percentages of dietary fishmeal, and thereby further reducing the stress on small pelagic marine fish. Other species where fermented or BSM have been evaluated include Atlantic cod (Gadus morhua) [50,51], Atlantic salmon (Salmo salar) [21], black sea bream (Acanthopagrus schlegeli) [52,53], Chinese sucker (Myxocyprinus asiaticus) [54], Florida pompano (Trachniotus carolinus) [38], gilthead sea bream (Sparus aurata L.) [55], Japanese flounder (Paralichthys olivaceus) [56], largemouth bass (Micropterus salmoides) [57], orange-spotted grouper (Epinephelus coioides) [58], whiteleg shrimp (Litopenaeus vannamei) [58-60], rockfish (Sebastes schlegeli) [61], white seabass (Atractosion nobilis) [62], and yellowtail jack (Seriola lalandi) [62].
Soybean products in the diets of salmonids have caused welldocumented and potentially deleterious effects in the distal intestine [12,63-67]. However, the lack of difference in gut histology among the diets is evidence that bioprocessing soybeans likely decreases antinutritional factors [22,23,43,47,48,65]. Saponins [16], and possibly other gastroinducing compounds, were evidently removed or decreased during bioprocessing. In comparison to other studies using a similar intestinal histology ranking system [42,48,68] the histological scores in this study tended to be lower. However, dietary formulations and rearing conditions were different between the studies.
The results of this study support the observations that exercise has a positive impact on fish rearing performance [24-27]. Voorhees et al. [69] also observed increased growth in exercised brown trout, but noticed that this positive result disappeared after approximately 60 days, possibly due to exercise fatigue. These results were not observed in this study, indicating that there may be species-specific responses to exercise. Although the higher velocity in this study produced a significantly poorer FCR, the relatively minor difference is not likely biologically significant. The increase in food fed to the higher velocity tanks in this study was due to more food being consumed to meet the increased energy demands from exercise [27,70-72]. Parker and Barnes [27] also noted that as long as fish were fed adequate amounts of feed then the fish that were exercised had the greatest growth.
Fin erosion can be due to several factors, including tankinduced abrasions [73], rearing unit size and type [74], aggressive behavior [75], feeding rates [76], rearing densities [77-79], dietary nutritional differences [80,81], environmental stress [75], and fish health [82]. The similar fin indices among the fish fed different diets and reared at different water velocities indicate the suitable nutritional content of the diets and favorable rearing conditions. Although few studies have reported relative fin lengths, the overall pectoral fin values observed in this experiment are similar to those reported by Parker and Barnes [27].
HSI is an indirect measure of glycogen and carbohydrate levels and can be used to indicate the nutritional state of the fish [83-85]. Although HSI values were significantly different among the diets, the ranges observed in this experiment are well within the range observed in other studies examining bioprocessed soybean products in rainbow trout diets [42,46,67]. They are also similar to those values reported for rainbow trout in velocity studies [27,86].
VSI indicates how lipids are being used or partitioned with VSI and lipid levels positively related [86-88]. Thus, the similar VSI values observed in this experiment are likely due to similar dietary lipid levels. The levels observed in this study are similar to those reported in other studies evaluating bioprocessed soybean product diets for rainbow trout [42,46,67]. Although the VSI was significantly affected by rearing velocity in this study, all of the values are in the range of those reported in other velocity studies with rainbow trout [27,87-89].
SSI is an indicator of hematopoietic capacity [83] and antibody production [90]. The similar SSI values observed in this experiment indicate that fish health was likely unaffected by dietary or velocity treatments. The SSI values observed were within the range reported for rainbow trout by other studies [27,47,68,86].
In conclusion, the results of this experiment indicate that juvenile rainbow trout respond similarly to exercise even when dietary fishmeal is replaced by at least 85% BSM. The suitability of BSM as a primary protein source provides additional ingredient options when formulating trout diets. Such flexibility in diet formulation is important given the large variation in market pricing for protein fish feed ingredients, as well as the geographic variation in ingredient availability. Additionally, regardless of diet, exercise can be used to improve growth in fish as long as adequate rations are provided. Future research should examine the complete replacement of fishmeal with BSM in rainbow trout subjected to different exercise regimes. Similar research should be conducted on other fish species. Lastly, the timing and duration of exercise to produce maximum rearing efficiencies should be evaluated for a wide variety of salmonid and other fish species as well.
Conflict of Interest
There are no conflicts of interest in this experiment.
Acknowledgements
Dan Durben provided comments on an earlier draft that improved this manuscript. The South Dakota Cooperative Fish and Wildlife Research Unit is jointly sponsored by the U.S. Geological Survey, South Dakota Department of Game, Fish and Parks, South Dakota State University, the Wildlife Management Institute, and the U.S. Fish and Wildlife Service. Any use of trade names is for descriptive purposes only and does not imply endorsement by the U.S. Government.
References
- https://www.fao.org/3/a-i5555e.pdf
- Cheng ZJ, Hardy RW (2004) Nutritional value of diets containing distiller’s dried grain with solubles for rainbow trout, Oncorhynchus mykiss. J Appl Aquac 15: 101-113.
- Kim KI, Kayes TB, Amundson CH (1991) Purified diet development and reevaluation of the dietary protein requirement of fingerling rainbow trout. (Oncorhynchus mykiss). Aquac 96: 57-67.
- Satia BP (1974) Quantitative protein requirements of rainbow trout. Prog Fish Cult 36: 80-85.
- Gatlin III DM, Barrows FT, Brown P, Dabrowski K, Gaylord TG, et al. (2007) Expanding the utilization of sustainable plant products: A review. Aquac Res 38: 551-579.
- Li MH, Robinson EH (2015) Complete feeds-intensive systems. In D. A. Davis (Ed.). Feed and feeding practices in aquaculture, Waltham, MD: Woodhead Publishing, .
- Nordrum S, Bakke-McKellep AM, Krogdahl Å, Buddington RK (2000) Effects of soybean meal and salinity on intestinal transport of nutrients in Atlantic salmon (Salmo salar L.) and rainbow trout (Oncorhynchus mykiss). Comp Biochem Physiol Part B Mol Biol 125: 317-335.
- Refstie S, Korsoen OJ, Storebakken T, Baeverfjord G, Lein I, et al. (2000) Differing nutritional responses to dietary soybean meal in rainbow trout (Oncorhynchus mykiss) and Atlantic salmon (Salmo salar). Aquac 190: 49-63.
- Sugiura HS, Dong FM, Rathbone CK, Hardy RW (1998) Apparent protein digestibility and mineral availabilities in various feed ingredients for salmonid feeds. Aquac 159: 177-202.
- Watanabe T (2002) Strategies for further development of aquatic feeds. Fish Sci 68: 242-252.
- National Research Council (NRC) (2011) Nutrient requirements of fish and shirmp. National Academy Press, Washington D. C., USA.
- Iwashita Y, Yamamoto T, Furuita H, Sugita T, Suzuki N (2008) Influence of certain soybean antinutritional factors supplemented to a casein-based semipurified diet on intestinal and liver morphology in fingerling rainbow trout Oncorhynchus mykiss. Fish Sci 74: 1075-1082.
- Teng D, Gao M, Yang Y, Liu B, Tian Z, et al. (2012) Bio-modification of soybean meal with Bacillus subtilis or Aspergillus oryzae. Biocata Ag Biotechnol 1: 32-38.
- Heikkinen J, Vielma J, Kemilainen O, Tiirola M, Eskelinen P, et al. (2006) Effects of soybean meal based diet on growth performance, gut histopathology and intestinal microbiota of juvenile rainbow trout (Oncorhynchus mykiss). Aquac 261: 259-268.
- Krogdahl Å, Bakke-McKellep AM, Roed KH, Baeverfjord G (2000) Feeding Atlantic salmon Salmo salar L. soybean products: effects on disease resistance (furunculosis), and lysozyme and IgM levels in the intestinal mucosa. Aquac Nut 6: 77-84.
- Krogdahl Å, Gajardo K, Kortner TM, Penn M, Gu M, et al. (2015) Soya saponins induce entritis in Atlantic salmon (Salmo salar L.). J Ag Food Chem 63: 3887-3902.
- Salunkhe DK, Chavan JK, Adsule RN, Kadam SS (1992) World oil seeds: Chemistry, technology, and uitlization. Van Nostrand Reinhold, New York.
- Bakke AM (2011) Pathophysiological and immunological characteristics of soybean meal-induced enteropathy in salmon: Contribution of recent molecular investigations. In LE Cruz-Suárex, D Ricque-Marie, M Tapia-Salazar, MG Nieto-López, DA Villarreal-Cavazos, J Gamboa-Delgado, L Hernández-Hernández (Eds.), Proceedings of international symposium aquaculture nutrition XI, Monterrey, Mexico pp. 345-372.
- Krogdahl Å, Penn M, Thorsen J, Refstie S, Bakke AM (2010) Important antinutrients in plant feedstuffs for aquaculture: An update on recent findings regarding responses in salmonids. Aquac Res 41: 333-344.
- Hong KJ, Lee CH, Kim SW (2004) Aspergillus oryzae GB-107 Fermentation Improves Nutritional Quality of Food Soybeans and Feed Soybean Meals. J Med Food 7: 430-435.
- Refstie S, Sahlstrom S, Brathen E, Baeverfjord G, Krogedal P (2005) Lactic acid fermentation eliminates indigestible carbohydrates and antinutritional factors in soybean meal for Atlantic salmon (Salmo salar). Aquac 246: 331-345.
- Yamamoto T, Iwashita Y, Matsunari H, Sugita T, Furuita H, et al. (2010) Influence of fermentation conditions for soybean meal in a non-fish meal diet on growth performance and physiological condition of rainbow trout Oncorhynchus mykiss. Aquac 309: 173-180.
- Yamamoto T, Matsunari H, Sugita T, Furuita H, Masumoto T, et al. (2012) Optimization of the supplemental essential amino acids to a fish meal-free diet based on fermented soybean meal for rainbow trout Oncorhynchus mykiss. Fish Sci 78: 359-366.
- Good C, May T, Crouse C, Summerfelt S, Welch TJ (2016) Assessing the impacts of swimming exercise and the relative susceptibility of rainbow trout Oncorhynchus mykiss (Walbaum) and Atlantic salmon Salmo salar L. following injection challenge with Weissella ceti. J Fish Dis 39: 1387-1391.
- Liu G, Wu Y, Qin X, Shi X, Wang X (2018) The effect of aerobic exercise training on growth performance, innate immune response, and disease resistance in juvenile Schizothorax prenanti. Aquac 486: 18-25.
- Parker TM, Barnes ME (2014) Rearing velocity impacts on landlocked fall Chinook salmon (Oncorhynchus tshawytscha) growth, condition, and survival. Open J Anim Sci 4: 244-252.
- Parker TM, Barnes ME (2015) Effects of different water velocities on hathcery rearing performance and recovery from transportation of rainbow trout fed two different rations. Trans Am Fish Soc 144: 882-890.
- Waldrop T, Summerfelt S, Mazik P, Good C (2018) The effects of swimming exercise and dissolved oxygen on growth performance, fin condition and precocious maturation of early-rearing Atlantic salmon Salmo salar. Aquac Res 49: 801-808.
- Association of Official Analytic Chemists (AOAC) (2009) Official methods of analysis [online version]. Gaithersburg, MD: retrieved from: https://www.eoma.aoac.org/.
- American Association of Cereal Chemists (AACC) (2000) Approved methods of the AACC (10th ed.). MN: American Association of Cereal Chemists, St. Paul.
- Butterbaugh GL, Willoughby H (1967) A feeding guide for brook, brown and rainbow trout. Prog Fish-Cult 29: 210-215.
- American Veterinary Medical Association (AVMA) (2013) AVMA guidelines for the euthanasia of animals (2013 ed.). IL: American Veterinary Medical Association, Schaumburg.
- Kindischi GA (1987) Method for quantifying degree of fin erosion. Prog Fish-Cult 49: 314-315.
- Busacker G, Adelman IR, Goolish EM (1990) Growth. In CB Schreck, PB Moyle (Eds.), Methods for fish biology. MD: American Fisheries Society, Bethesda, pp. 363-387.
- Goede RW, Barton BA (1990) Organismic indices and an autopsy-based assessment as indicators of health and condition in fish. In SM Adams (Ed.), Biological indicators of stress in fish: Symp. 8. MD: American Fisheries Society, Bethesda.
- Booman M, Forster I, Vederas JC, Groma, DB, Jones SRM (2018) Soybean meal-induced enteritis in Atlantic salmon (Salmo salar) and Chinook salmon (Oncorhynchus tshawytscha) but not in pink salmon (O. gorbuscha). Aquac 483: 238-243.
- Gu M, Bai N, Xu B, Jia Q, Zhang Z (2017) Protective effect of glutamine and arginine against soybean meal-induced entreritis in juvenile turbot (Scophthalmus maximusi). Fish Shellfish Immunol 70: 95-105.
- Novriadi R, Rhodes M, Powell M, Hanson T, Davis DA (2018) Effects of soybean meal replacement with fermented soybean meal on growth, serum biochemistry, and morphological condition of liver and distal intestine of Florida pompano Trachinotus carolinus. Aquac Nutr 24: 1066-1075.
- Wang Y, Wang L, Zhang C, Song K (2017) Effects of substituting fishmeal with soybean meal on growth performance and intestinal morphology in orange-spotted grouper (Epinephelus coioides). Aquac Rep 5: 52-57.
- Bureau DP, Harris AM, Cho CY (1998) The effects of purified alcohol extracts from soy products on feed intake and growth of chinook salmon (Oncorhynchus tshawytscha) and rainbow trout (Oncorhynchus mykiss). Aquac 72: 27-43.
- Burrells C, Williams PD, Southgate PJ, Crampton VO (1999) Immunological, physiological and pathological responses of rainbow trout (Oncorhynchus mykiss) to increasing dietary concentrations of soybean proteins. Vet Immunol Immunopathol 72: 277-288.
- Barnes ME, Brown ML, Bruce T, Sindelar S, Neiger R (2014) Rainbow trout rearing performance, intestinal morphology, and immune response after long-term feeding of high levels of fermented soybean meal. N Am J Aquac 76: 333-345.
- Colburn HR, Walker AB, Breton TS, Stilwell JM, Sidor IF, et al. (2012) Partial replacement of fishmeal with soybean meal and soy protein concentrate in diets of Atlantic cod. N Am J Aquac 74: 330-337.
- Knudsen D, Uran P, Arnous A, Koppe W, Frokiaer H (2007) Saponin-containing subfractions of soybean molasses induce entritis in the distal intestine of Atlantic salmon. J Ag Food Chem 55: 2261-2267.
- Barnes ME, Brown ML, Rosentrater KA, Sewell JR (2012) An initial investigation replacing fish meal with a commercial fermented soybean meal product in the diets of juvenile rainbow trout. Open J Anim Sci 2: 234-243.
- Barnes ME, Brown ML, Neiger R (2015) Comparative performance of two rainbow trout strains fed fermented soybean meal. Aquac Int 23: 1227-1238.
- Bruce TJ, Sindelar SC, Voorhees JM, Brown ML, Barnes ME (2017) Performance and immunological responses of rainbow trout (Oncorhynchus mykiss) fed bioprocessed plant-based proteins. Aquac Nutr 23: 1160-1168.
- Bruce TJ, Neiger RD, Brown ML (2018) Gut histology, immunology and the intestinal microbiota of rainbow trout, Oncorhynchus mykiss (Walbaum), fed process variants of soybean meal. Aquac Res 49: 492-504. 49.
- Voorhees JM, Barnes ME, Chipps SR, Brown ML (2018) Direct substitution of fishmeal with bioprocessed soybean meal in brown trout diets. J Fish Aquac Dev: JFAD-143.
- Refstie S, Landsverk T, Bakke-McKellep AM, Ringø E, Sundby A (2006) Digestive capacity, intestinal morphology, and microflora of 1-year and 2-year old Atlantic cod (Gadus morhua) fed standard or bioprocessed soybean meal. Aquac 261: 269-284.
- Ringø E, Sperstad S, Myklebust R, Refstie S, Krogdahl Å (2006) Characterisation of the microbiota associated with intestine of Atlantic cod (Gadus morhus L.) the effect of fish meal, standard soybean meal and a bioprocessed soybean meal. Aquac 261: 829-841.
- Azarm HM, Lee S-M (2014) Effects of partial substitution of dietary fish meal by fermented soybean meal on growth performance, amino acid and biochemical parameters of juvenile black sea bream Acanthopagrus schlegeli. Aquac Res 45: 994-1003.
- Zhou F, Song W, Shao Q, Peng X, Xiao J, et al. (2011) Partial replacement of fish meal by fermented soybean meal in diets for black sea bream, Acanthopagrus schlegelii, juveniles. J World Aquac Soc 42: 184-197.
- Yuan YC, Lin YC, Yang HJ, Gong Y, Gong SY, et al (2012) Evaluation of fermented soybean meal in practical diets for juvenile Chinese sucker, Myxocyprinus asiaticus. Aquac Nutr 19: 74-83.
- Kokou F, Rigos G, Henry M, Kentouri M, Alexis M (2012) Growth performance, feed utilization and non-specific immune response of gilthead sea bream (Sparus aurata L.) fed graded levels of bioprocessed soybean meal. Aquac 364-365: 74-81.
- Kader MA, Koshio S, Ishikawa M, Yokoyama S, Bulbul M, Nguyen BT, et al. (2012) Can fermented soybean meal and squid by-product blend be used as fishmeal replacements for Japanese flounder (Paralichthys olivaceus)? Aquac Res 43: 1427-1438.
- Jiang Y, Zhao P-F, Tang R-J, Chen Y-J, Luo L (2018) Partial substitution of soybean meal with fermented soybean residue in diets for juvenile largemouth bass, Micropterus salmoides. Aquac Nutr 24: 1213-1222.
- Shiu Y-L, Hsieh S-L, Guei W-C, Tsai Y-T, Chiu C-H, et al. (2015) Using Bacillus subtilis E20-fermented soybean meal as replacement for fish meal in the diet of orange-spotted grouper (Epinephelus coioides, Hamilton). Aquac Res 46: 1403-1416.
- Chiu S-T, Wong S-L, Shiu Y-L, Chiu C-H, Guei W-C, et al. (2016) Using a fermented mixture of soybean meal and earthworm, meal to replace fish meal in the diet of white shrimp, Penaeu vannamei (Boone). Aquac Res 47: 3489-3500.
- Van Nguyen N, Hoang L, Van Khanh T, Duy Hai P, Hung LT (2018) Utilization of fermented soybean meal for fishmeal substitution in diets of Pacific white shrimp (Litopenaeus vannamei). Aquac Nutr 24: 1092-1100.
- Lee S-M, Azarm HM, Chang KH (2016) Effects of dietary inclusion of fermented soybean meal on growth, body composition, antioxidant enzyme activity and disease resistance of rockfish (Sebastes schlegeli). Aquac 459: 110-116.
- Trushenski JT, Rombenso AN, Page M, Jirsa D, Drawbridge M (2014) Traditional and fermented soybean meal as ingredients in feed for white seabass and yellowtail jack. N Am J Aquac 76: 312-322.
- Barrows FT, Gaylord TG, Sealey WM, Haas MJ, Stroup RL (2008) Processing soybean meal for biodiesel production: effect of a new processing method on growth performance of rainbow trout, Oncorhynchus mykiss. Aquac 283: 141-147.
- Merrifield DL, Dimitroglou A, Bradley G, Baker RTM, Davies SJ (2009) Soybean meal alters autochthonous microbial populations, microvilli morphology and compromises intestinal enterocyte integrity of rainbow trout, Oncorhynchus mykiss. J Fish Dis 32: 755-766.
- Romarheim OH, Skrede A, Gao Y, Krogdahl Ǻ, Denstadli V, et al. (2008) Comparison of white flakes and toasted soybean meal partly replacing fish meal as protein source in extruded feed for rainbow trout (Oncorhynchus mykiss). Aquac 256: 354-364.
- Sealey WM, Barrows FT, Smith CE, Overturf K, LaPatra SE (2009) Soybean meal level and probiotics in first feeding fry diets alter the ability of rainbow trout Oncorhynchus mykiss to utilize high levels of soybean meal during grow-out. Aquac 293: 195-203.
- Barnes ME, Brown ML, Rosentrater KA, Sewell JR (2013) Preliminary evaluation of rainbow trout diets containing PepSoyGen, a fermented soybean meal product, and additional amino acids. Open Fish Sci J 6 19-27.
- Barnes ME, Brown ML, Bruce TJ, Neiger R, Sindelar S (2015) Effects of fermented soybean meal diet on rainbow trout mortality and immune function during a disease outbreak. J Aquac Feed Sci Nutr 7: 6-15.
- Voorhees JM, Barnes ME, Chipps SR, Brown ML (2018) Rearing performance of juvenile brown trout (Salmo salar) subjected to exercise and dietary bioprocessed soybean meal. Op J Anim Sci 8: 303-328.
- Azevedo PA, Cho CY, Leeson S, Bureau DP (1998) Effects of feeding level and water temperature on growth, nutrient and energy utilization and waste outputs of rainbow trout (Oncorhynchus mykiss). Aquat Liv Res 11: 227-238.
- Kiessling A, Higgs D, Dosanjh B, Eales J (1994) Influence of sustained exercise at two ration levels on growth and thyroid function of all-female Chinook salmon (Oncorhyhchus tshawystcha) in seawater. Can J Fish Aquat Sci 51: 1975-1984.
- Rasmussen RS, Ostenfeld TH (2000) Effect of growth rate on quality traits and feed utilisation of rainbow trout (Oncorhynchus mykiss) and brook trout (Salvelinus fontinalis). Aquac 184: 327-337.
- Bosakowski T, Wagner EJ (1995) Experimental use of cobble substrates in concrete raceways for improving fin condition of cutthroat (Oncorhynchus clarki) and rainbow trout (O. mykiss). Aquac 130: 159-165.
- Bosakowski T, Wagner EJ (1994) Assessment of fish erosion by comparison of relative fin length in hatchery and wild trout in Utah. Can J Fish Aquat Sci 51: 636-641.
- Latremouille DN (2003) Fin erosion in aquaculture and natural environments. Rev Fish Sci 11: 315-335.
- Wagner EJ, Intelmann SS, Routledge D (1996) The effect of fry rearing density on hatchery performance, fin condition, and agonistic behavior or rainbow trout (Oncorhynchus mykiss) fry. J World Aquac Soc 27: 264-274.
- Miller SA, Wagner EJ, Bosakowski T (1995) Performance and oxygen consumption of rainbow trout reared at two densities in raceways with oxygen supplementation. Prog Fish-Cult 57: 206-212.
- North BP, Turnbull JF, Ellis T, Porter MJ, Migaud H, et al. (2006) The impact of stocking density on the welfare of rainbow trout (Oncorhynchus mykiss). Aquac 255: 466-479.
- Wagner EJ, Jeppsen T, Arndt R, Routledge MD, Bradwisch Q (1997) Effects of rearing density upon cutthroat trout hematology, hatchery performance, fin erosion, and general health condition. Prog Fish-Cult 59: 173-187.
- Kindschi GA, Shaw HT, Bruhn DS (1991) Effect of diet on performance, fin quality, and dorsal skin lesions in steelhead. J Appl Aquac 1: 113-120.
- Lemm CA, Rottiers DV, Dropkin DS, Dennison BA (1988) Growth, composition, and fin quality of Atlantic salmon fed different diets at seasonal temperatures in a laboratory and hatchery. U.S. Fish Wildl Serv Biol Rep 88: 1-12.
- Devesa S, Barja JL, Toranzo AE (1989) Ulcerative skin and fin lesions in reared Turbot, Scopthalmus maximus (L.). J Fish Dis 12: 323-333.
- Barton BA, Morgan JD, Vijayanm MM (2002) Physiological and condition-related indicators of environmental stress in fish. In SM Adams (Ed.), Biological indicators of aquatic ecosystem stress. MD: America Fisheries Society, Bethesda, pp. 111-148.
- Daniels WH, Robinson EH (1986) Protein and energy requirements of juvenile red drum (Sciaenops ocellatus). Aquac 53: 243-252.
- Kim JD, Kaushik SJ (1992) Contributions of digestible energy from carbohydrates and stimation of protein/energy requirements for growth of rainbow trout (Oncorhynchus mykiss). Aquac 106: 161-169.
- Kientz JL, Barnes ME (2016) Structural complexity improves the rearing performance of rainbow trout in circular tanks. N Am J Aquac 78: 203-207.
- Company R, Calduch-Giner JA, Kaushik S, Perez-Sanchez J (1999) Growth performance and adiposity in gilthead sea bream (Sparus aurata): risks and benefits of high energy diets. Aquac 171: 279-292.
- Jobling M, Koskela J, Savolainen R (1998) Influence of dietary fat level and increased adiposity on growth and fat deposition in rainbow trout, Oncorhynchus mykiss (Walbaum). Aquac Res 29: 601-607.
- Yildiz M, Sener E, Timur M (2006) Effect of seasonal change and different commercial feeds on proximate composition of sea bream (Sparus aurata). Turk J Fish Aquat Sci 6: 99-104.
- Smith LS (1991) Introduction to fish physiology. Redmond, WA: Argent Laboratories Press.

Open Access Journals
- Aquaculture & Veterinary Science
- Chemistry & Chemical Sciences
- Clinical Sciences
- Engineering
- General Science
- Genetics & Molecular Biology
- Health Care & Nursing
- Immunology & Microbiology
- Materials Science
- Mathematics & Physics
- Medical Sciences
- Neurology & Psychiatry
- Oncology & Cancer Science
- Pharmaceutical Sciences